Financial Advisor Salary in Ardmore, OK: $91,315 (2026)
Quick Answer:A full-time financial advisor in Ardmore, OK earns a median $91,315/year (≈ $43.90/hour) in nominal terms for 2026 — projected from BLS OEWS 2025 (SOC 13-2052). Once you factor in Ardmore's price level (11% below national, BEA RPP 88.9), that paycheck buys what $102,717 would nationally. Nominal pay sits 5.4% below the Oklahoma state average.
Based on BLS state-level estimates · View source
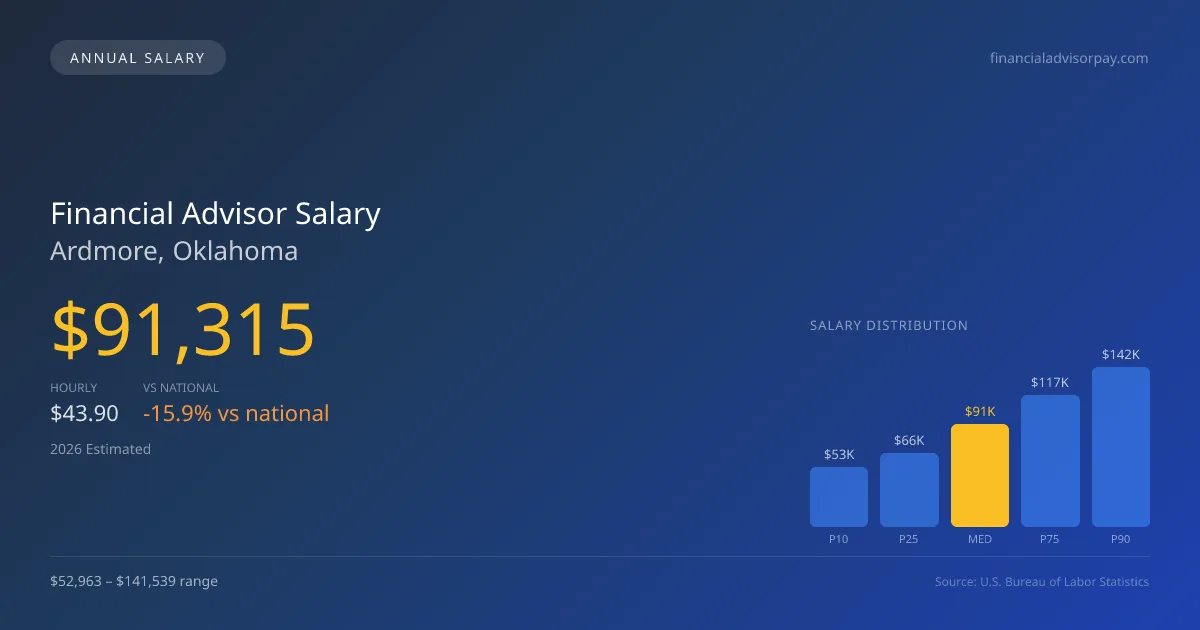
Financial advisors in Ardmore, OK have a projected median annual salary of $91,315 for 2026, which reflects a notable yet competitive compensation landscape compared to the national median of $108,537. This figure falls within a salary range from $52,963 at the lower end (P10) to $141,539 at the upper end (P90). Local estimates derived from 2025 BLS data suggest that the financial advisor market here is influenced by a rising demand for fiduciary services, particularly in fee-only advisory models. Interestingly, the demand is likely fueled in part by stronger client preferences for Certified Financial Planner (CFP) credentials, which can command a premium in Ardmore's smaller but growing market.
About the Ardmore Market
Salary estimated from Oklahoma average ($82,000) adjusted for local cost of living.
Salary Breakdown
| Percentile | Annual | Hourly |
|---|---|---|
| Entry Level (P10) | $52,963 | $25.46 |
| Lower Range (P25) | $65,747 | $31.61 |
| Median (P50)(typical) | $91,315 | $43.90 |
| Upper Range (P75) | $116,883 | $56.20 |
| Top Earners (P90) | $141,539 | $68.04 |
Median Salary Position
15.87% below the national average
2026 Salary Percentile Distribution in Ardmore
In Ardmore, OK, the financial advisor salary spread from the 10th to 90th percentile is $88,576 (2026 est.). At $91,315, the local median is 15.87% below the national median of $108,537.
Salary Calculator
At 40 hours/week in Ardmore: You'd be in the lower-middle range
How Ardmore Financial Advisor Pay Compares
Ardmore median: $91,315/year (2026)
| Compared To | Median Salary | Ardmore Pays |
|---|---|---|
| Oklahoma Average | $96,528 | -5.40% less |
| National Average | $108,537 | -15.87% less |
Financial Advisors in Ardmore, OK earn a median of $91,315 per year (2026 est.), which is 15.87% lower than the national median of $108,537 and 5.40% below the Oklahoma state average of $96,528.
Cost-of-Living Adjusted Salary
Ardmore has a cost of living 11.10% below the national average, meaning your salary goes further here.
Adjusted salary = nominal × (100 / CoL index). CoL index: 100 = national average.
Ardmore, OK has a cost-of-living index of 88.9 (below the national average of 100). A financial advisor earning $91,315 nominally has purchasing power equivalent to $102,717 in an average-cost city — an effective 12.49% boost.
Compare Purchasing Power
Select a city to see how your salary compares after cost of living
Select a city above to compare purchasing power
2019 BLS Actual
$73,910
2025 BLS Actual
$88,398
2026 Current Est.
$91,315
2019–2027 Growth
+27.6%
Salary Trajectory for Financial Advisors in Ardmore (2019–2027)
2019–2025: actual BLS OEWS data for this metro area. 2026+: CAGR 3.30% projection.
| Year | Annual Salary | Status |
|---|---|---|
| 2019 | $73,910 | Actual |
| 2020 | $75,156 | Actual |
| 2021 | $79,228 | Actual |
| 2022 | $80,254 | Actual |
| 2023 | $83,779 | Actual |
| 2024 | $68,989 | Actual |
| 2025 | $88,398 | Actual |
| 2026(current) | $91,315 | Estimated |
| 2027 | $94,329 | Projected |
Based on 7 years of BLS OEWS data for the Ardmore metropolitan area, the median financial advisor salary grew 19.6% from $73,910 (2019) to $88,398 (2025). At a 3.30% compound annual growth rate, salaries are projected to reach $94,329 by 2027 — a total increase of $20,419 (27.63%) from 2019.
Note: Historical values (2019–2025) are actual BLS OEWS figures for the Ardmore metropolitan area, sourced from annual Occupational Employment and Wage Statistics surveys. 2026–2026 figures are current estimates, and 2027 values are projections, calculated using a 3.30% CAGR derived from 7-year BLS historical data. Actual salaries may vary based on employer, experience, certifications, and local market conditions.
Salary by Experience Level
| Experience | Estimated Salary Range |
|---|---|
| 0-2 years (New Graduate) | $52,963 – $65,747 |
| 3-5 years (Mid Career) | $65,747 – $91,315 |
| 5+ years (Experienced) | $91,315 – $116,883 |
| 10+ years (Top Earner) | $116,883 – $141,539 |
CFP, FA salary ranges estimated from BLS percentile data. Individual financial advisor compensation varies by employer, certifications, and specialization.
Financial Advisor Job Market in Ardmore
In Ardmore, the financial advisory job market comprises around seven professionals, an indication of a tight industry environment where the potential for individual growth can be substantial. With a cost of living index of 88.9, advisors in this region may find their take-home pay extends further compared to other areas, creating an advantageous situation for those who tailor their offerings to the local clientele. Employers such as independent broker-dealers and Registered Investment Advisors (RIAs) typically lead in compensation, given their fee structures that align better with client needs compared to traditional wirehouses. Factors such as assets under management (AUM) and client demographics play a significant role in income disparity between advisors, as those managing higher AUM or focusing on high-net-worth (HNW) individuals often command a better fee structure. For aspiring financial advisors in Ardmore, pursuing the CFP designation, developing a niche market, and leveraging local networks can enhance earning potential in this competitive field.
More salary data for Ardmore, OK:
Frequently Asked Questions
How much do financial advisors make in Ardmore, OK in 2026?
Is Ardmore, OK a good place to work as a financial advisor?
Can financial advisors make $100K in Ardmore?
What is the cost-of-living adjusted financial advisor salary in Ardmore?
How much does a financial advisor make per hour in Ardmore?
Related Pages
Compare Salaries
Career Resources
Nearby Cities in Oklahoma
Written by Jordan Lee, CFP
Career Analyst
Jordan has over 10 years of experience in financial planning. They specialize in retirement planning for individuals. They work at a financial services firm in New York City.
Methodology & Data Source
Salary figures on this page are 2026 projections based on the Bureau of Labor Statistics Occupational Employment and Wage Statistics (OEWS) survey, May 2026 release. The BLS reported a median annual salary of $88,398 for financial advisorsin the Ardmore metropolitan area. A 3.30% compound annual growth rate (CAGR), calculated from 6-year national BLS wage trends, was applied to project current 2026 compensation. Percentile ranges (P10–P90) represent the full salary distribution across experience levels and practice settings in this market.
Data Sources & Methodology
Salary data for Ardmore is estimated from official BLS state-level occupational wage data (2025), adjusted for regional cost-of-living differences using BEA RPP (Regional Price Parities).
2026 figures are projected from 2025 BLS data using a compound annual growth rate (CAGR) of 3.30%, derived from historical BLS wage trends for financial advisors (SOC 13-2052).
Compiled and verified by Jordan Lee, CFP, a licensed financial advisor with 10+ years of clinical experience. · View source data at BLS.gov