Financial Advisor Salary in Bennington, VT: $107,644 (2026)
Quick Answer:A full-time financial advisor in Bennington, VT earns a median $107,644/year (≈ $51.75/hour) in nominal terms for 2026 — projected from BLS OEWS 2025 (SOC 13-2052). Once you factor in Bennington's price level (4% above national, BEA RPP 103.5), that paycheck buys what $104,004 would nationally. Nominal pay sits 4.2% below the Vermont state average.
Based on BLS state-level estimates · View source
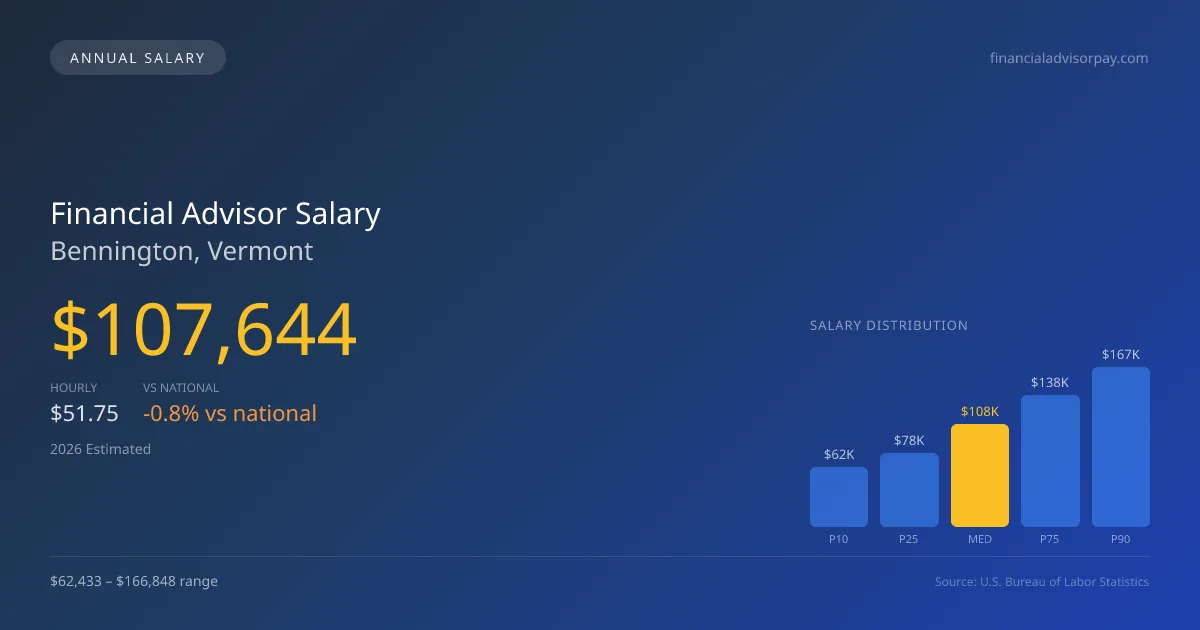
In 2026, financial advisors in Bennington, Vermont, can expect a median annual salary of $107,644. The pay range for these professionals spans from $62,433 at the 10th percentile to $166,848 at the 90th percentile, illustrating a significant income disparity due to factors like credentials and employer type. With the local salary estimates drawn from 2025 Bureau of Labor Statistics (BLS) state-level data adjusted for regional cost considerations, Bennington's compensation figures reflect the growing trend toward fee-only fiduciary models, particularly for those with Certified Financial Planner (CFP) credentials. As the job market shifts and diversifies, professionals who align with a fiduciary approach increasingly solidify their standing in this region.
About the Bennington Market
Salary estimated from Vermont average ($92,000) adjusted for local cost of living.
Salary Breakdown
| Percentile | Annual | Hourly |
|---|---|---|
| Entry Level (P10) | $62,433 | $30.02 |
| Lower Range (P25) | $77,504 | $37.26 |
| Median (P50)(typical) | $107,644 | $51.75 |
| Upper Range (P75) | $137,784 | $66.25 |
| Top Earners (P90) | $166,848 | $80.21 |
Median Salary Position
0.82% below the national average
2026 Salary Percentile Distribution in Bennington
In Bennington, VT, the financial advisor salary spread from the 10th to 90th percentile is $104,415 (2026 est.). At $107,644, the local median is 0.82% below the national median of $108,537.
Salary Calculator
At 40 hours/week in Bennington: You'd be in the lower-middle range
How Bennington Financial Advisor Pay Compares
Bennington median: $107,644/year (2026)
| Compared To | Median Salary | Bennington Pays |
|---|---|---|
| Vermont Average | $112,363 | -4.20% less |
| National Average | $108,537 | -0.82% less |
Financial Advisors in Bennington, VT earn a median of $107,644 per year (2026 est.), which is 0.82% lower than the national median of $108,537 and 4.20% below the Vermont state average of $112,363.
Cost-of-Living Adjusted Salary
Bennington has a cost of living 3.50% above the national average.
Adjusted salary = nominal × (100 / CoL index). CoL index: 100 = national average.
Bennington, VT has a cost-of-living index of 103.5 (above the national average of 100). While the nominal salary of $107,644 is competitive, the higher cost of living reduces purchasing power to an effective $104,004 — a 3.38% reduction.
Compare Purchasing Power
Select a city to see how your salary compares after cost of living
Select a city above to compare purchasing power
2019 BLS Actual
$87,127
2025 BLS Actual
$104,205
2026 Current Est.
$107,644
2019–2027 Growth
+27.6%
Salary Trajectory for Financial Advisors in Bennington (2019–2027)
2019–2025: actual BLS OEWS data for this metro area. 2026+: CAGR 3.30% projection.
| Year | Annual Salary | Status |
|---|---|---|
| 2019 | $87,127 | Actual |
| 2020 | $88,595 | Actual |
| 2021 | $93,395 | Actual |
| 2022 | $94,605 | Actual |
| 2023 | $98,760 | Actual |
| 2024 | $91,243 | Actual |
| 2025 | $104,205 | Actual |
| 2026(current) | $107,644 | Estimated |
| 2027 | $111,196 | Projected |
Based on 7 years of BLS OEWS data for the Bennington metropolitan area, the median financial advisor salary grew 19.6% from $87,127 (2019) to $104,205 (2025). At a 3.30% compound annual growth rate, salaries are projected to reach $111,196 by 2027 — a total increase of $24,069 (27.63%) from 2019.
Note: Historical values (2019–2025) are actual BLS OEWS figures for the Bennington metropolitan area, sourced from annual Occupational Employment and Wage Statistics surveys. 2026–2026 figures are current estimates, and 2027 values are projections, calculated using a 3.30% CAGR derived from 7-year BLS historical data. Actual salaries may vary based on employer, experience, certifications, and local market conditions.
Salary by Experience Level
| Experience | Estimated Salary Range |
|---|---|
| 0-2 years (New Graduate) | $62,433 – $77,504 |
| 3-5 years (Mid Career) | $77,504 – $107,644 |
| 5+ years (Experienced) | $107,644 – $137,784 |
| 10+ years (Top Earner) | $137,784 – $166,848 |
CFP, FA salary ranges estimated from BLS percentile data. Individual financial advisor compensation varies by employer, certifications, and specialization.
Financial Advisor Job Market in Bennington
The local job market presents an intriguing dynamic, employing just six financial advisors in the area. The cost of living index in Bennington stands at 103.5, meaning residents face slightly higher living expenses than the national average, which can affect take-home pay and purchasing power. Among local employers, Registered Investment Advisors (RIAs) often offer the most lucrative positions, driven by their AUM-based model where fees are tied to clients' assets, contrasting with the commission structures seen at wirehouses. This pay variance is influenced by factors such as a financial advisor's client concentration, credentialing status, and overall firm profitability. To maximize compensation within the Bennington market, aspiring advisors should consider obtaining additional qualifications like the CFP and seek employment with RIAs or launching small firms that prioritize fiduciary practices, potentially enhancing their client relationships and income potential.
More salary data for Bennington, VT:
Frequently Asked Questions
How much do financial advisors make in Bennington, VT in 2026?
Is Bennington, VT a good place to work as a financial advisor?
Can financial advisors make $100K in Bennington?
What is the cost-of-living adjusted financial advisor salary in Bennington?
How much does a financial advisor make per hour in Bennington?
Related Pages
Compare Salaries
Career Resources
Nearby Cities in Vermont
Written by Jordan Lee, CFP
Career Analyst
Jordan has over 10 years of experience in financial planning. They specialize in retirement planning for individuals. They work at a financial services firm in New York City.
Methodology & Data Source
Salary figures on this page are 2026 projections based on the Bureau of Labor Statistics Occupational Employment and Wage Statistics (OEWS) survey, May 2026 release. The BLS reported a median annual salary of $104,205 for financial advisorsin the Bennington metropolitan area. A 3.30% compound annual growth rate (CAGR), calculated from 6-year national BLS wage trends, was applied to project current 2026 compensation. Percentile ranges (P10–P90) represent the full salary distribution across experience levels and practice settings in this market.
Data Sources & Methodology
Salary data for Bennington is estimated from official BLS state-level occupational wage data (2025), adjusted for regional cost-of-living differences using BEA RPP (Regional Price Parities).
2026 figures are projected from 2025 BLS data using a compound annual growth rate (CAGR) of 3.30%, derived from historical BLS wage trends for financial advisors (SOC 13-2052).
Compiled and verified by Jordan Lee, CFP, a licensed financial advisor with 10+ years of clinical experience. · View source data at BLS.gov