Financial Advisor Salary in Lancaster, PA: $103,104 (2026)
Quick Answer:A full-time financial advisor in Lancaster, PA earns a median $103,104/year (≈ $49.57/hour) in nominal terms for 2026 — projected from BLS OEWS 2025 (SOC 13-2052). Once you factor in Lancaster's price level (2% below national, BEA RPP 98.3), that paycheck buys what $104,933 would nationally. Nominal pay sits 1.8% below the Pennsylvania state average.
Official BLS data · View source
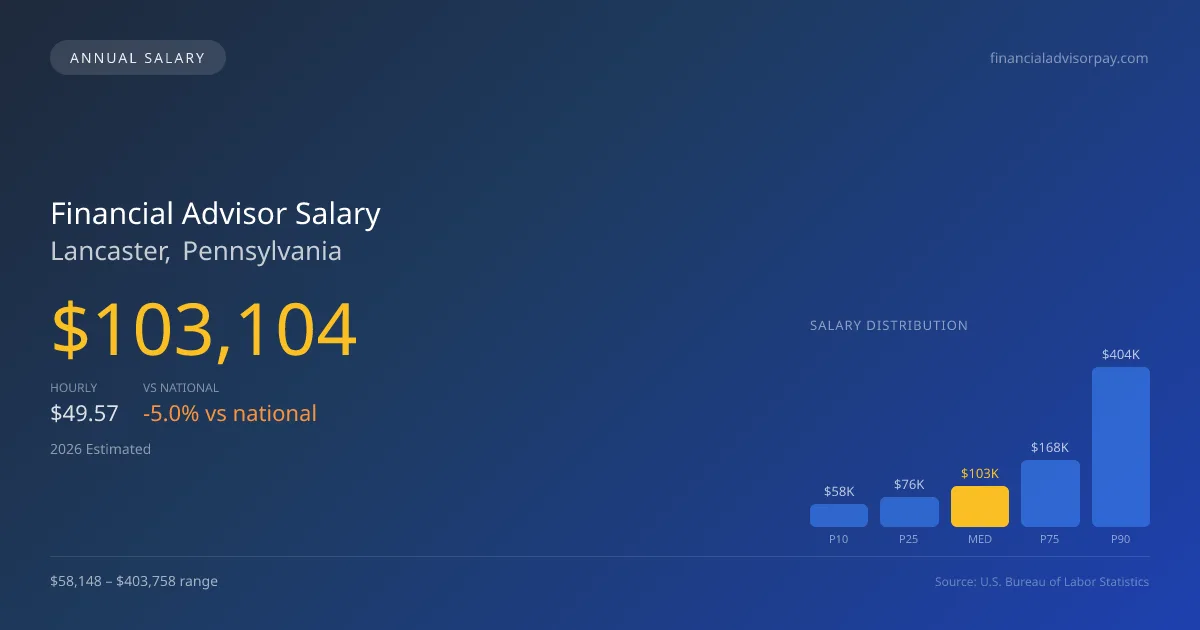
Financial advisors in Lancaster, Pennsylvania, can expect a median annual salary of $103,104 in 2026, reflecting a competitive position within the local job market. This salary range spans from $58,148 at the low end (P10) to a remarkable $403,758 at the high end (P90), showcasing the significant potential for earnings based on experience and expertise. These figures are derived from official Bureau of Labor Statistics (BLS) OEWS surveys, indicating a promising outlook for professionals in this field. Transitioning to an independent model can dramatically influence long-term compensation, allowing advisors to benefit from a fiduciary fee structure or equity stakes in their own business. Lancaster's financial landscape is distinctly shaped by these dynamics, revealing a landscape ripe with opportunities for seasoned advisors willing to adapt.
Salary Breakdown
| Percentile | Annual | Hourly |
|---|---|---|
| Entry Level (P10) | $58,148 | $27.95 |
| Lower Range (P25) | $75,554 | $36.33 |
| Median (P50)(typical) | $103,104 | $49.57 |
| Upper Range (P75) | $167,997 | $80.77 |
| Top Earners (P90) | $403,758 | $194.11 |
Median Salary Position
5.01% below the national average
2026 Salary Percentile Distribution in Lancaster
In Lancaster, PA, the financial advisor salary spread from the 10th to 90th percentile is $345,610 (2026 est.). At $103,104, the local median is 5.01% below the national median of $108,537.
Salary Calculator
At 40 hours/week in Lancaster: You'd be in the entry-level range
How Lancaster Financial Advisor Pay Compares
Lancaster median: $103,104/year (2026)
| Compared To | Median Salary | Lancaster Pays |
|---|---|---|
| Pennsylvania Average | $104,994 | -1.80% less |
| National Average | $108,537 | -5.01% less |
Financial Advisors in Lancaster, PA earn a median of $103,104 per year (2026 est.), which is 5.01% lower than the national median of $108,537 and 1.80% below the Pennsylvania state average of $104,994.
Cost-of-Living Adjusted Salary
Lancaster has a cost of living 1.74% below the national average, meaning your salary goes further here.
Adjusted salary = nominal × (100 / CoL index). CoL index: 100 = national average.
Lancaster, PA has a cost-of-living index of 98.257 (below the national average of 100). A financial advisor earning $103,104 nominally has purchasing power equivalent to $104,933 in an average-cost city — an effective 1.77% boost.
Compare Purchasing Power
Select a city to see how your salary compares after cost of living
Select a city above to compare purchasing power
2019 BLS Actual
$94,360
2025 BLS Actual
$99,810
2026 Current Est.
$103,104
2019–2027 Growth
+12.9%
Salary Trajectory for Financial Advisors in Lancaster (2019–2027)
2019–2025: actual BLS OEWS data for this metro area. 2026+: CAGR 3.30% projection.
| Year | Annual Salary | Status |
|---|---|---|
| 2019 | $94,360 | Actual |
| 2020 | $91,890 | Actual |
| 2021 | $101,100 | Actual |
| 2022 | $102,910 | Actual |
| 2023 | $97,230 | Actual |
| 2024 | $121,610 | Actual |
| 2025 | $99,810 | Actual |
| 2026(current) | $103,104 | Estimated |
| 2027 | $106,506 | Projected |
Based on 7 years of BLS OEWS data for the Lancaster metropolitan area, the median financial advisor salary grew 5.8% from $94,360 (2019) to $99,810 (2025). At a 3.30% compound annual growth rate, salaries are projected to reach $106,506 by 2027 — a total increase of $12,146 (12.87%) from 2019.
Note: Historical values (2019–2025) are actual BLS OEWS figures for the Lancaster metropolitan area, sourced from annual Occupational Employment and Wage Statistics surveys. 2026–2026 figures are current estimates, and 2027 values are projections, calculated using a 3.30% CAGR derived from 7-year BLS historical data. Actual salaries may vary based on employer, experience, certifications, and local market conditions.
Salary by Experience Level
| Experience | Estimated Salary Range |
|---|---|
| 0-2 years (New Graduate) | $58,148 – $75,554 |
| 3-5 years (Mid Career) | $75,554 – $103,104 |
| 5+ years (Experienced) | $103,104 – $167,997 |
| 10+ years (Top Earner) | $167,997 – $403,758 |
CFP, FA salary ranges estimated from BLS percentile data. Individual financial advisor compensation varies by employer, certifications, and specialization.
Financial Advisor Job Market in Lancaster
The financial advisory sector in Lancaster employs approximately 360 professionals, a number reflecting the city’s growing demand for wealth management services. Addressing the cost-of-living index of 98.257, which is below the national average, financial advisors here enjoy enhanced purchasing power, improving their overall quality of life. Among local employers, wirehouses like Morgan Stanley and Merrill Lynch tend to offer the highest salaries; however, independent broker-dealers such as LPL and Raymond James are attractive alternatives due to their commission structures, which can enhance earnings over time. The disparity in salaries can largely be attributed to factors like assets under management (AUM), fee models, and the presence of high-net-worth clients. Those looking to maximize their financial advisor pay in Lancaster PA would do well to pursue further certifications like the CFP or CFA, which can directly improve earning potential and client trust.
More salary data for Lancaster, PA:
Frequently Asked Questions
How much do financial advisors make in Lancaster, PA in 2026?
Is Lancaster, PA a good place to work as a financial advisor?
Can financial advisors make $100K in Lancaster?
What is the cost-of-living adjusted financial advisor salary in Lancaster?
How much does a financial advisor make per hour in Lancaster?
Related Pages
Compare Salaries
Career Resources
Nearby Cities in Pennsylvania
Written by Jordan Lee, CFP
Career Analyst
Jordan has over 10 years of experience in financial planning. They specialize in retirement planning for individuals. They work at a financial services firm in New York City.
Methodology & Data Source
Salary figures on this page are 2026 projections based on the Bureau of Labor Statistics Occupational Employment and Wage Statistics (OEWS) survey, May 2026 release. The BLS reported a median annual salary of $99,810 for financial advisorsin the Lancaster metropolitan area. A 3.30% compound annual growth rate (CAGR), calculated from 6-year national BLS wage trends, was applied to project current 2026 compensation. Percentile ranges (P10–P90) represent the full salary distribution across experience levels and practice settings in this market.
Data Sources & Methodology
Source: BLS, OEWS, 7-year dataset (–). Per-city data from annual BLS metropolitan area surveys.
2026 figures are projected from 2025 BLS data using a compound annual growth rate (CAGR) of 3.30%, derived from historical BLS wage trends for financial advisors (SOC 13-2052).
Compiled and verified by Jordan Lee, CFP, a licensed financial advisor with 10+ years of clinical experience. · View source data at BLS.gov