Financial Advisor Salary in Trenton, NJ: $133,391 (2026)
Quick Answer:A full-time financial advisor in Trenton, NJ earns a median $133,391/year (≈ $64.13/hour) in nominal terms for 2026 — projected from BLS OEWS 2025 (SOC 13-2052). Once you factor in Trenton's price level (3% above national, BEA RPP 103.2), that paycheck buys what $129,280 would nationally. Nominal pay sits 6.7% above the New Jersey state average.
Official BLS data · View source
Financial advisors in Trenton, New Jersey, are projected to earn a median annual salary of $133,391 in 2026, which is significantly higher than the national median of $108,537. The salary range for these professionals extends from $86,090 at the lower end to an impressive $328,866 for those at the top of the pay scale. This discrepancy in earnings can often be attributed to the structural divide within the industry, particularly between wirehouses and Registered Investment Advisors (RIAs). Advisors affiliated with wirehouses may rely more on a commission-based model, while those operating as fiduciaries tend to earn through assets under management (AUM), significantly affecting their overall compensation. This dynamic is reflective of the broader trends shaping financial advisor compensation in Trenton, with opportunities for growth driven by market demand and advisor credentials.
Salary Breakdown
| Percentile | Annual | Hourly |
|---|---|---|
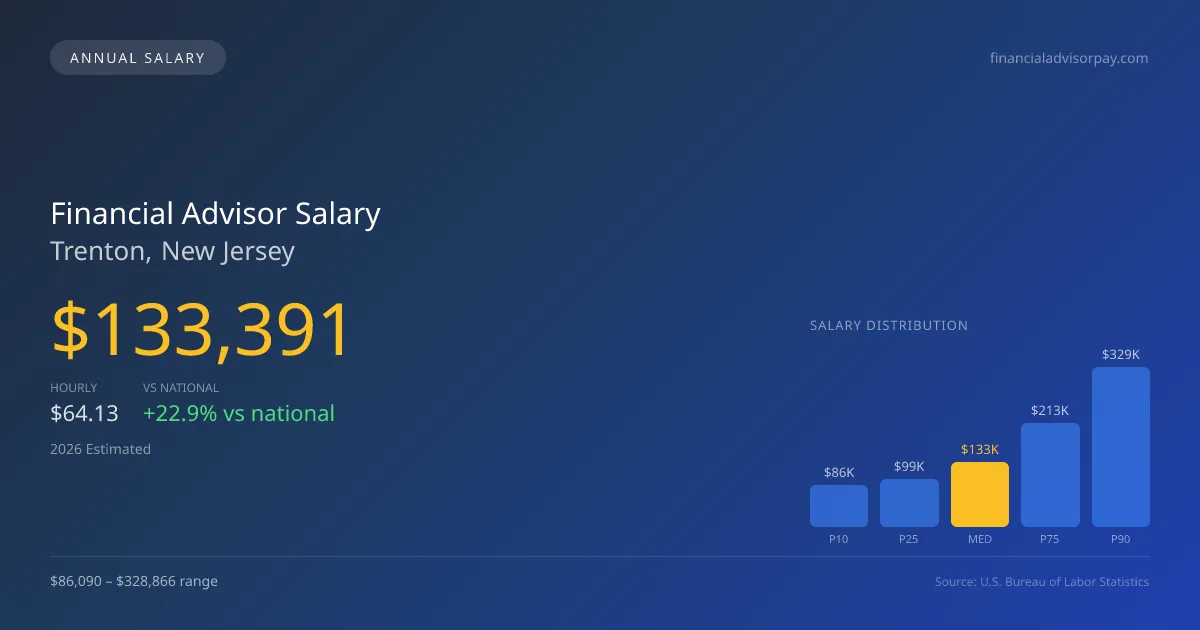
| Entry Level (P10) | $86,090 | $41.39 |
| Lower Range (P25) | $98,899 | $47.55 |
| Median (P50)(typical) | $133,391 | $64.13 |
| Upper Range (P75) | $213,387 | $102.59 |
| Top Earners (P90) | $328,866 | $158.11 |
Median Salary Position
22.90% above the national average
2026 Salary Percentile Distribution in Trenton
In Trenton, NJ, the financial advisor salary spread from the 10th to 90th percentile is $242,776 (2026 est.). At $133,391, the local median is 22.9% above the national median of $108,537.
Salary Calculator
At 40 hours/week in Trenton: You'd be in the entry-level range
How Trenton Financial Advisor Pay Compares
Trenton median: $133,391/year (2026)
| Compared To | Median Salary | Trenton Pays |
|---|---|---|
| New Jersey Average | $125,015 | +6.70% more |
| National Average | $108,537 | +22.90% more |
Financial Advisors in Trenton, NJ earn a median of $133,391 per year (2026 est.), which is 22.90% higher than the national median of $108,537 and 6.70% above the New Jersey state average of $125,015.
Cost-of-Living Adjusted Salary
Trenton has a cost of living 3.18% above the national average.
Adjusted salary = nominal × (100 / CoL index). CoL index: 100 = national average.
Trenton, NJ has a cost-of-living index of 103.18 (above the national average of 100). While the nominal salary of $133,391 is competitive, the higher cost of living reduces purchasing power to an effective $129,280 — a 3.08% reduction.
Compare Purchasing Power
Select a city to see how your salary compares after cost of living
Select a city above to compare purchasing power
2019 BLS Actual
$107,967
2025 BLS Actual
$129,130
2026 Current Est.
$133,391
2019–2027 Growth
+27.6%
Salary Trajectory for Financial Advisors in Trenton (2019–2027)
2019–2025: actual BLS OEWS data for this metro area. 2026+: CAGR 3.30% projection.
| Year | Annual Salary | Status |
|---|---|---|
| 2019 | $107,967 | Actual |
| 2020 | $118,060 | Actual |
| 2021 | $96,570 | Actual |
| 2022 | $117,800 | Actual |
| 2023 | $112,850 | Actual |
| 2024 | $102,590 | Actual |
| 2025 | $129,130 | Actual |
| 2026(current) | $133,391 | Estimated |
| 2027 | $137,793 | Projected |
Based on 7 years of BLS OEWS data for the Trenton metropolitan area, the median financial advisor salary grew 19.6% from $107,967 (2019) to $129,130 (2025). At a 3.30% compound annual growth rate, salaries are projected to reach $137,793 by 2027 — a total increase of $29,826 (27.63%) from 2019.
Note: Historical values (2019–2025) are actual BLS OEWS figures for the Trenton metropolitan area, sourced from annual Occupational Employment and Wage Statistics surveys. 2026–2026 figures are current estimates, and 2027 values are projections, calculated using a 3.30% CAGR derived from 7-year BLS historical data. Actual salaries may vary based on employer, experience, certifications, and local market conditions.
Salary by Experience Level
| Experience | Estimated Salary Range |
|---|---|
| 0-2 years (New Graduate) | $86,090 – $98,899 |
| 3-5 years (Mid Career) | $98,899 – $133,391 |
| 5+ years (Experienced) | $133,391 – $213,387 |
| 10+ years (Top Earner) | $213,387 – $328,866 |
CFP, FA salary ranges estimated from BLS percentile data. Individual financial advisor compensation varies by employer, certifications, and specialization.
Financial Advisor Job Market in Trenton
The local job market boasts approximately 1,070 financial advisors, indicating a healthy demand for wealth management services in Trenton, NJ. With a cost-of-living index of 103.18, compensation must keep pace to maintain purchasing power in this region. Employers such as Morgan Stanley and Merrill Lynch represent the wirehouse segment that typically offers competitive salaries, while independent broker-dealers and RIAs, like LPL and Raymond James, are becoming increasingly relevant due to the shift toward fee-only structures. The disparity in pay can usually be linked to factors such as client concentration, advisor credentials (CFP or CFA), and the fee models employed. To maximize earnings potential in this competitive environment, financial advisors should focus on building a robust AUM while cultivating high-net-worth clients, which can be especially rewarding for those with strong professional credentials.
More salary data for Trenton, NJ:
Frequently Asked Questions
How much do financial advisors make in Trenton, NJ in 2026?
Is Trenton, NJ a good place to work as a financial advisor?
Can financial advisors make $100K in Trenton?
What is the cost-of-living adjusted financial advisor salary in Trenton?
How much does a financial advisor make per hour in Trenton?
Related Pages
Compare Salaries
Career Resources
Nearby Cities in New Jersey
Written by Jordan Lee, CFP
Career Analyst
Jordan has over 10 years of experience in financial planning. They specialize in retirement planning for individuals. They work at a financial services firm in New York City.
Methodology & Data Source
Salary figures on this page are 2026 projections based on the Bureau of Labor Statistics Occupational Employment and Wage Statistics (OEWS) survey, May 2026 release. The BLS reported a median annual salary of $129,130 for financial advisorsin the Trenton metropolitan area. A 3.30% compound annual growth rate (CAGR), calculated from 6-year national BLS wage trends, was applied to project current 2026 compensation. Percentile ranges (P10–P90) represent the full salary distribution across experience levels and practice settings in this market.
Data Sources & Methodology
Source: BLS, OEWS, 6-year dataset (–). Per-city data from annual BLS metropolitan area surveys.
2026 figures are projected from 2025 BLS data using a compound annual growth rate (CAGR) of 3.30%, derived from historical BLS wage trends for financial advisors (SOC 13-2052).
Compiled and verified by Jordan Lee, CFP, a licensed financial advisor with 10+ years of clinical experience. · View source data at BLS.gov