Financial Advisor Salary in St. Joseph, MO: $76,855 (2026)
Quick Answer:A full-time financial advisor in St. Joseph, MO earns a median $76,855/year (≈ $36.95/hour) in nominal terms for 2026 — projected from BLS OEWS 2025 (SOC 13-2052). Once you factor in St. Joseph's price level (14% below national, BEA RPP 86.4), that paycheck buys what $88,971 would nationally. Nominal pay sits 0.7% below the Missouri state average.
Official BLS data · View source
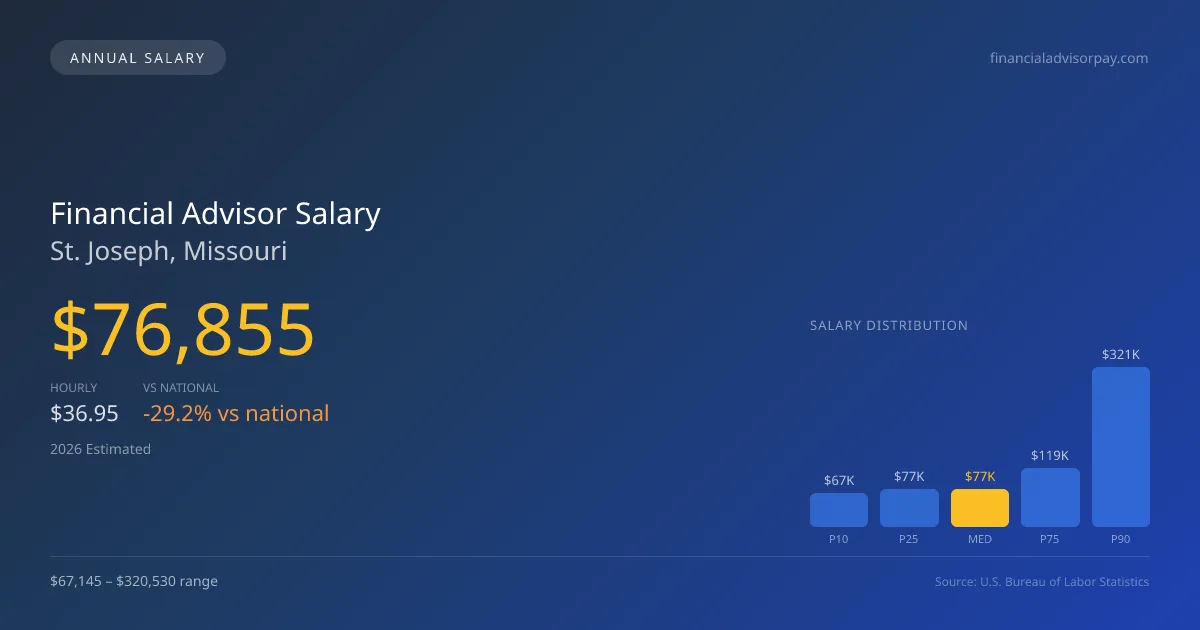
In St. Joseph, Missouri, the estimated financial advisor salary in 2026 stands at $76,855, which reflects a significant gap compared to the national median of $108,537. The salary range for financial advisors in this region is quite broad, with earnings projected from $67,145 at the 10th percentile to an impressive $320,530 at the 90th percentile. This data, derived from 2025 BLS OEWS surveys and projected for 2026, highlights the structural divide in compensation models between wirehouses and Registered Investment Advisors (RIAs). As the financial advisory space shifts toward a fiduciary model, the assets under management (AUM) approach commonly employed by RIAs tends to influence earnings, contrasting sharply with the commission-based compensation structure prevalent in wirehouse firms.
Salary Breakdown
| Percentile | Annual | Hourly |
|---|---|---|
| Entry Level (P10) | $67,145 | $32.28 |
| Lower Range (P25) | $76,855 | $36.95 |
| Median (P50)(typical) | $76,855 | $36.95 |
| Upper Range (P75) | $118,754 | $57.09 |
| Top Earners (P90) | $320,530 | $154.10 |
Median Salary Position
29.19% below the national average
2026 Salary Percentile Distribution in St. Joseph
In St. Joseph, MO, the financial advisor salary spread from the 10th to 90th percentile is $253,385 (2026 est.). At $76,855, the local median is 29.19% below the national median of $108,537.
Salary Calculator
At 40 hours/week in St. Joseph: You'd be in the entry-level range
How St. Joseph Financial Advisor Pay Compares
St. Joseph median: $76,855/year (2026)
| Compared To | Median Salary | St. Joseph Pays |
|---|---|---|
| Missouri Average | $77,397 | -0.70% less |
| National Average | $108,537 | -29.19% less |
Financial Advisors in St. Joseph, MO earn a median of $76,855 per year (2026 est.), which is 29.19% lower than the national median of $108,537 and 0.70% below the Missouri state average of $77,397.
Cost-of-Living Adjusted Salary
St. Joseph has a cost of living 13.62% below the national average, meaning your salary goes further here.
Adjusted salary = nominal × (100 / CoL index). CoL index: 100 = national average.
St. Joseph, MO has a cost-of-living index of 86.382 (below the national average of 100). A financial advisor earning $76,855 nominally has purchasing power equivalent to $88,971 in an average-cost city — an effective 15.76% boost.
Compare Purchasing Power
Select a city to see how your salary compares after cost of living
Select a city above to compare purchasing power
2019 BLS Actual
$55,670
2025 BLS Actual
$74,400
2026 Current Est.
$76,855
2019–2027 Growth
+42.6%
Salary Trajectory for Financial Advisors in St. Joseph (2019–2027)
2019–2025: actual BLS OEWS data for this metro area. 2026+: CAGR 3.30% projection.
| Year | Annual Salary | Status |
|---|---|---|
| 2019 | $55,670 | Actual |
| 2020 | $63,255 | Actual |
| 2021 | $65,180 | Actual |
| 2022 | $67,546 | Actual |
| 2023 | $70,513 | Actual |
| 2024 | $82,669 | Actual |
| 2025 | $74,400 | Actual |
| 2026(current) | $76,855 | Estimated |
| 2027 | $79,391 | Projected |
Based on 7 years of BLS OEWS data for the St. Joseph metropolitan area, the median financial advisor salary grew 33.6% from $55,670 (2019) to $74,400 (2025). At a 3.30% compound annual growth rate, salaries are projected to reach $79,391 by 2027 — a total increase of $23,721 (42.61%) from 2019.
Note: Historical values (2019–2025) are actual BLS OEWS figures for the St. Joseph metropolitan area, sourced from annual Occupational Employment and Wage Statistics surveys. 2026–2026 figures are current estimates, and 2027 values are projections, calculated using a 3.30% CAGR derived from 7-year BLS historical data. Actual salaries may vary based on employer, experience, certifications, and local market conditions.
Salary by Experience Level
| Experience | Estimated Salary Range |
|---|---|
| 0-2 years (New Graduate) | $67,145 – $76,855 |
| 3-5 years (Mid Career) | $76,855 – $76,855 |
| 5+ years (Experienced) | $76,855 – $118,754 |
| 10+ years (Top Earner) | $118,754 – $320,530 |
CFP, FA salary ranges estimated from BLS percentile data. Individual financial advisor compensation varies by employer, certifications, and specialization.
Financial Advisor Job Market in St. Joseph
Analyzing the job market for financial advisors in St. Joseph reveals that 50 professionals are currently employed in the area. Given the cost-of-living index of 86.382, the purchasing power for advisors in the region is more favorable compared to many national averages, allowing them to maximize take-home income. Leading firms such as Morgan Stanley and Northwestern Mutual often provide substantial pay packages, especially for advisors with high net-worth (HNW) client bases. The variation in compensation can largely be attributed to factors such as AUM book size, the fee model adopted, and the presence of CFP or CFA credentials. For financial advisors looking to boost their earnings in St. Joseph, focusing on building a robust portfolio of clients and acquiring additional qualifications can be effective strategies to navigate the local competitive landscape.
More salary data for St. Joseph, MO:
Frequently Asked Questions
How much do financial advisors make in St. Joseph, MO in 2026?
Is St. Joseph, MO a good place to work as a financial advisor?
Can financial advisors make $100K in St. Joseph?
What is the cost-of-living adjusted financial advisor salary in St. Joseph?
How much does a financial advisor make per hour in St. Joseph?
Related Pages
Compare Salaries
Career Resources
Nearby Cities in Missouri
Written by Jordan Lee, CFP
Career Analyst
Jordan has over 10 years of experience in financial planning. They specialize in retirement planning for individuals. They work at a financial services firm in New York City.
Methodology & Data Source
Salary figures on this page are 2026 projections based on the Bureau of Labor Statistics Occupational Employment and Wage Statistics (OEWS) survey, May 2026 release. The BLS reported a median annual salary of $74,400 for financial advisorsin the St. Joseph metropolitan area. A 3.30% compound annual growth rate (CAGR), calculated from 6-year national BLS wage trends, was applied to project current 2026 compensation. Percentile ranges (P10–P90) represent the full salary distribution across experience levels and practice settings in this market.
Data Sources & Methodology
Source: BLS, OEWS, 4-year dataset (–). Per-city data from annual BLS metropolitan area surveys.
2026 figures are projected from 2025 BLS data using a compound annual growth rate (CAGR) of 3.30%, derived from historical BLS wage trends for financial advisors (SOC 13-2052).
Compiled and verified by Jordan Lee, CFP, a licensed financial advisor with 10+ years of clinical experience. · View source data at BLS.gov