Financial Advisor Salary in Plymouth, MN: $84,217 (2026)
Quick Answer:A full-time financial advisor in Plymouth, MN earns a median $84,217/year (≈ $40.49/hour) in nominal terms for 2026 — projected from BLS OEWS 2025 (SOC 13-2052). Once you factor in Plymouth's price level (1% below national, BEA RPP 98.5), that paycheck buys what $85,499 would nationally. Nominal pay sits 1.0% below the Minnesota state average.
Based on BLS state-level estimates · View source
In 2026, the financial advisor salary in Plymouth, MN, is projected to be a median of $84,217, which is significantly lower than the national median of $108,537. The salary range for financial advisors in this area spans from $48,846 at the 10th percentile to $130,537 at the 90th percentile. These figures stem from estimates based on 2025 BLS data and regional price adjustments. It's evident that the compensation landscape in Plymouth reflects a notable disparity compared to national averages, driven by local market dynamics and employment patterns. As more professionals consider transitioning to independent practice, this shift could reshape long-term earnings for advisors in the area.
About the Plymouth Market
Salary estimated from Minnesota average ($108,000) adjusted for local cost of living.
Salary Breakdown
| Percentile | Annual | Hourly |
|---|---|---|
| Entry Level (P10) | $48,846 | $23.48 |
| Lower Range (P25) | $60,636 | $29.15 |
| Median (P50)(typical) | $84,217 | $40.49 |
| Upper Range (P75) | $107,799 | $51.83 |
| Top Earners (P90) | $130,537 | $62.75 |
Median Salary Position
22.41% below the national average
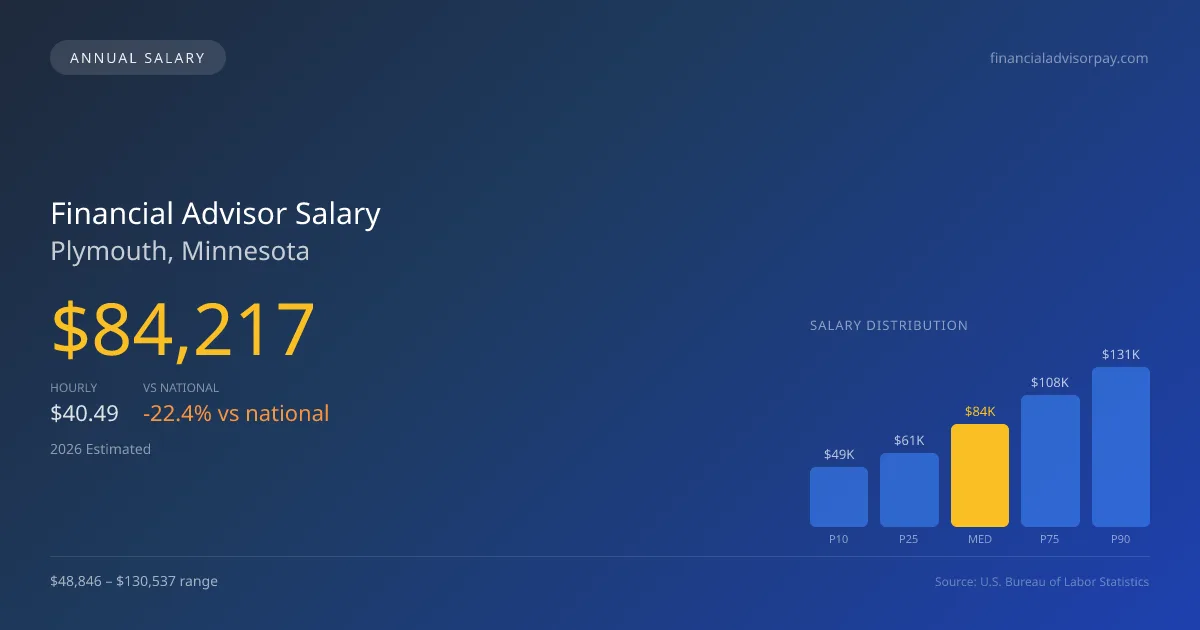
2026 Salary Percentile Distribution in Plymouth
In Plymouth, MN, the financial advisor salary spread from the 10th to 90th percentile is $81,691 (2026 est.). At $84,217, the local median is 22.41% below the national median of $108,537.
Salary Calculator
At 40 hours/week in Plymouth: You'd be in the lower-middle range
How Plymouth Financial Advisor Pay Compares
Plymouth median: $84,217/year (2026)
| Compared To | Median Salary | Plymouth Pays |
|---|---|---|
| Minnesota Average | $85,068 | -1.00% less |
| National Average | $108,537 | -22.41% less |
Financial Advisors in Plymouth, MN earn a median of $84,217 per year (2026 est.), which is 22.41% lower than the national median of $108,537 and 1.00% below the Minnesota state average of $85,068.
Cost-of-Living Adjusted Salary
Plymouth has a cost of living 1.50% below the national average, meaning your salary goes further here.
Adjusted salary = nominal × (100 / CoL index). CoL index: 100 = national average.
Plymouth, MN has a cost-of-living index of 98.5 (below the national average of 100). A financial advisor earning $84,217 nominally has purchasing power equivalent to $85,499 in an average-cost city — an effective 1.52% boost.
Compare Purchasing Power
Select a city to see how your salary compares after cost of living
Select a city above to compare purchasing power
2019 BLS Actual
$68,165
2025 BLS Actual
$81,527
2026 Current Est.
$84,217
2019–2027 Growth
+27.6%
Salary Trajectory for Financial Advisors in Plymouth (2019–2027)
2019–2025: actual BLS OEWS data for this metro area. 2026+: CAGR 3.30% projection.
| Year | Annual Salary | Status |
|---|---|---|
| 2019 | $68,165 | Actual |
| 2020 | $69,314 | Actual |
| 2021 | $73,069 | Actual |
| 2022 | $74,016 | Actual |
| 2023 | $77,267 | Actual |
| 2024 | $105,278 | Actual |
| 2025 | $81,527 | Actual |
| 2026(current) | $84,217 | Estimated |
| 2027 | $86,997 | Projected |
Based on 7 years of BLS OEWS data for the Plymouth metropolitan area, the median financial advisor salary grew 19.6% from $68,165 (2019) to $81,527 (2025). At a 3.30% compound annual growth rate, salaries are projected to reach $86,997 by 2027 — a total increase of $18,832 (27.63%) from 2019.
Note: Historical values (2019–2025) are actual BLS OEWS figures for the Plymouth metropolitan area, sourced from annual Occupational Employment and Wage Statistics surveys. 2026–2026 figures are current estimates, and 2027 values are projections, calculated using a 3.30% CAGR derived from 7-year BLS historical data. Actual salaries may vary based on employer, experience, certifications, and local market conditions.
Salary by Experience Level
| Experience | Estimated Salary Range |
|---|---|
| 0-2 years (New Graduate) | $48,846 – $60,636 |
| 3-5 years (Mid Career) | $60,636 – $84,217 |
| 5+ years (Experienced) | $84,217 – $107,799 |
| 10+ years (Top Earner) | $107,799 – $130,537 |
CFP, FA salary ranges estimated from BLS percentile data. Individual financial advisor compensation varies by employer, certifications, and specialization.
Financial Advisor Job Market in Plymouth
The financial landscape in Plymouth is shaped by a concentrated group of 14 financial advisors, highlighting the tight-knit job market. The cost-of-living index of 98.5 suggests that residents experience a slightly more affordable lifestyle than the national average, enhancing the purchasing power of local salaries. Top employers, such as wirehouses like Morgan Stanley and Merrill Lynch, typically offer higher compensation packages, yet evolving trends are propelling many advisors toward independent Registered Investment Advisors, who prioritize transparency and fiduciary standards. The variation in pay among advisors is influenced by factors such as assets under management and client relationships. Advisors seeking to maximize their pay should focus on developing high-net-worth client portfolios and considering certifications like CFP or CFA that command higher fees. Understanding the local competitive landscape will be essential for those looking to enhance their financial advisor pay in Plymouth MN.
More salary data for Plymouth, MN:
Frequently Asked Questions
How much do financial advisors make in Plymouth, MN in 2026?
Is Plymouth, MN a good place to work as a financial advisor?
Can financial advisors make $100K in Plymouth?
What is the cost-of-living adjusted financial advisor salary in Plymouth?
How much does a financial advisor make per hour in Plymouth?
Related Pages
Compare Salaries
Career Resources
Nearby Cities in Minnesota
Written by Jordan Lee, CFP
Career Analyst
Jordan has over 10 years of experience in financial planning. They specialize in retirement planning for individuals. They work at a financial services firm in New York City.
Methodology & Data Source
Salary figures on this page are 2026 projections based on the Bureau of Labor Statistics Occupational Employment and Wage Statistics (OEWS) survey, May 2026 release. The BLS reported a median annual salary of $81,527 for financial advisorsin the Plymouth metropolitan area. A 3.30% compound annual growth rate (CAGR), calculated from 6-year national BLS wage trends, was applied to project current 2026 compensation. Percentile ranges (P10–P90) represent the full salary distribution across experience levels and practice settings in this market.
Data Sources & Methodology
Salary data for Plymouth is estimated from official BLS state-level occupational wage data (2025), adjusted for regional cost-of-living differences using BEA RPP (Regional Price Parities).
2026 figures are projected from 2025 BLS data using a compound annual growth rate (CAGR) of 3.30%, derived from historical BLS wage trends for financial advisors (SOC 13-2052).
Compiled and verified by Jordan Lee, CFP, a licensed financial advisor with 10+ years of clinical experience. · View source data at BLS.gov