Financial Advisor Salary in Andover, MN: $82,008 (2026)
Quick Answer:A full-time financial advisor in Andover, MN earns a median $82,008/year (≈ $39.43/hour) in nominal terms for 2026 — projected from BLS OEWS 2025 (SOC 13-2052). Once you factor in Andover's price level (1% below national, BEA RPP 98.5), that paycheck buys what $83,257 would nationally. Nominal pay sits 3.6% below the Minnesota state average.
Based on BLS state-level estimates · View source
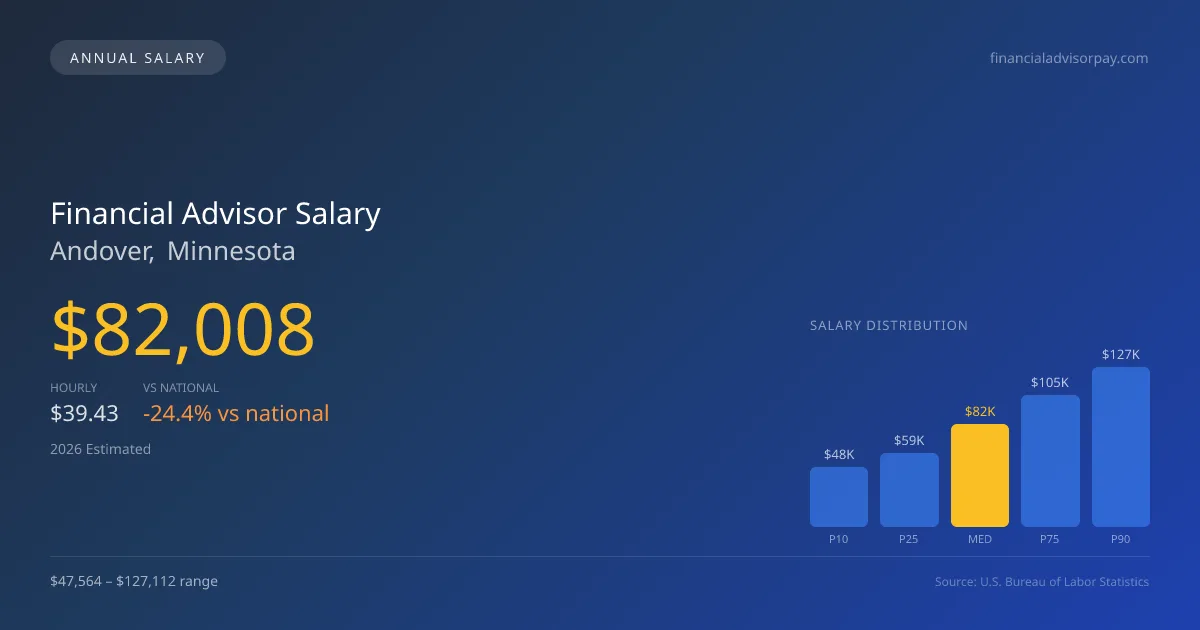
In 2026, a financial advisor in Andover, Minnesota, is projected to earn a median annual salary of $82,008, significantly lower than the national median of $108,537. The local salary range stretches from $47,564 at the 10th percentile to $127,112 at the 90th percentile. These figures are derived from state-level estimates based on 2025 BLS data, adjusted for regional cost disparities. In this market, the divergence in earning potential can largely be attributed to the structural differences between wirehouse firms and Registered Investment Advisors (RIAs). Advisors affiliated with wirehouses often operate on commission models, which can lead to variability in income, while RIAs primarily utilize an assets under management (AUM) model, offering more predictable earnings tied to the growth of their client base.
About the Andover Market
Salary estimated from Minnesota average ($108,000) adjusted for local cost of living.
Salary Breakdown
| Percentile | Annual | Hourly |
|---|---|---|
| Entry Level (P10) | $47,564 | $22.87 |
| Lower Range (P25) | $59,045 | $28.39 |
| Median (P50)(typical) | $82,008 | $39.43 |
| Upper Range (P75) | $104,970 | $50.46 |
| Top Earners (P90) | $127,112 | $61.11 |
Median Salary Position
24.44% below the national average
2026 Salary Percentile Distribution in Andover
In Andover, MN, the financial advisor salary spread from the 10th to 90th percentile is $79,548 (2026 est.). At $82,008, the local median is 24.44% below the national median of $108,537.
Salary Calculator
At 40 hours/week in Andover: You'd be in the lower-middle range
How Andover Financial Advisor Pay Compares
Andover median: $82,008/year (2026)
| Compared To | Median Salary | Andover Pays |
|---|---|---|
| Minnesota Average | $85,070 | -3.60% less |
| National Average | $108,537 | -24.44% less |
Financial Advisors in Andover, MN earn a median of $82,008 per year (2026 est.), which is 24.44% lower than the national median of $108,537 and 3.60% below the Minnesota state average of $85,070.
Cost-of-Living Adjusted Salary
Andover has a cost of living 1.50% below the national average, meaning your salary goes further here.
Adjusted salary = nominal × (100 / CoL index). CoL index: 100 = national average.
Andover, MN has a cost-of-living index of 98.5 (below the national average of 100). A financial advisor earning $82,008 nominally has purchasing power equivalent to $83,257 in an average-cost city — an effective 1.52% boost.
Compare Purchasing Power
Select a city to see how your salary compares after cost of living
Select a city above to compare purchasing power
2019 BLS Actual
$66,377
2025 BLS Actual
$79,388
2026 Current Est.
$82,008
2019–2027 Growth
+27.6%
Salary Trajectory for Financial Advisors in Andover (2019–2027)
2019–2025: actual BLS OEWS data for this metro area. 2026+: CAGR 3.30% projection.
| Year | Annual Salary | Status |
|---|---|---|
| 2019 | $66,377 | Actual |
| 2020 | $67,495 | Actual |
| 2021 | $71,152 | Actual |
| 2022 | $72,074 | Actual |
| 2023 | $75,240 | Actual |
| 2024 | $102,516 | Actual |
| 2025 | $79,388 | Actual |
| 2026(current) | $82,008 | Estimated |
| 2027 | $84,714 | Projected |
Based on 7 years of BLS OEWS data for the Andover metropolitan area, the median financial advisor salary grew 19.6% from $66,377 (2019) to $79,388 (2025). At a 3.30% compound annual growth rate, salaries are projected to reach $84,714 by 2027 — a total increase of $18,337 (27.63%) from 2019.
Note: Historical values (2019–2025) are actual BLS OEWS figures for the Andover metropolitan area, sourced from annual Occupational Employment and Wage Statistics surveys. 2026–2026 figures are current estimates, and 2027 values are projections, calculated using a 3.30% CAGR derived from 7-year BLS historical data. Actual salaries may vary based on employer, experience, certifications, and local market conditions.
Salary by Experience Level
| Experience | Estimated Salary Range |
|---|---|
| 0-2 years (New Graduate) | $47,564 – $59,045 |
| 3-5 years (Mid Career) | $59,045 – $82,008 |
| 5+ years (Experienced) | $82,008 – $104,970 |
| 10+ years (Top Earner) | $104,970 – $127,112 |
CFP, FA salary ranges estimated from BLS percentile data. Individual financial advisor compensation varies by employer, certifications, and specialization.
Financial Advisor Job Market in Andover
Currently, the market in Andover employs only eight financial advisors, reflecting a niche segment within the local job landscape. Despite a cost-of-living index of 98.5, which suggests lower living expenses compared to national averages, the financial advisor pay in Andover MN remains competitive for those looking to maximize their earnings. Employers such as Morgan Stanley and Wells Fargo Advisors often offer the most generous compensation packages, particularly in commission-driven roles, while RIAs like Northwestern Mutual and independent broker-dealers can provide significant payouts through fee-based structures. The substantial spread in salaries here can be influenced by factors including AUM book size, client engagement, and advisory credentials, like holding a CFP or CFA. For aspiring advisors seeking higher compensation, prioritizing a transition towards an RIA model or enhancing their credentialing may be strategic moves in the evolving Andover market.
More salary data for Andover, MN:
Frequently Asked Questions
How much do financial advisors make in Andover, MN in 2026?
Is Andover, MN a good place to work as a financial advisor?
Can financial advisors make $100K in Andover?
What is the cost-of-living adjusted financial advisor salary in Andover?
How much does a financial advisor make per hour in Andover?
Related Pages
Compare Salaries
Career Resources
Nearby Cities in Minnesota
Written by Jordan Lee, CFP
Career Analyst
Jordan has over 10 years of experience in financial planning. They specialize in retirement planning for individuals. They work at a financial services firm in New York City.
Methodology & Data Source
Salary figures on this page are 2026 projections based on the Bureau of Labor Statistics Occupational Employment and Wage Statistics (OEWS) survey, May 2026 release. The BLS reported a median annual salary of $79,388 for financial advisorsin the Andover metropolitan area. A 3.30% compound annual growth rate (CAGR), calculated from 6-year national BLS wage trends, was applied to project current 2026 compensation. Percentile ranges (P10–P90) represent the full salary distribution across experience levels and practice settings in this market.
Data Sources & Methodology
Salary data for Andover is estimated from official BLS state-level occupational wage data (2025), adjusted for regional cost-of-living differences using BEA RPP (Regional Price Parities).
2026 figures are projected from 2025 BLS data using a compound annual growth rate (CAGR) of 3.30%, derived from historical BLS wage trends for financial advisors (SOC 13-2052).
Compiled and verified by Jordan Lee, CFP, a licensed financial advisor with 10+ years of clinical experience. · View source data at BLS.gov