Financial Advisor Salary in Des Moines, IA: $97,381 (2026)
Quick Answer:A full-time financial advisor in Des Moines, IA earns a median $97,381/year (≈ $46.82/hour) in nominal terms for 2026 — projected from BLS OEWS 2025 (SOC 13-2052). Once you factor in Des Moines's price level (8% below national, BEA RPP 91.7), that paycheck buys what $106,194 would nationally. Nominal pay sits 2.5% above the Iowa state average.
Official BLS data · View source
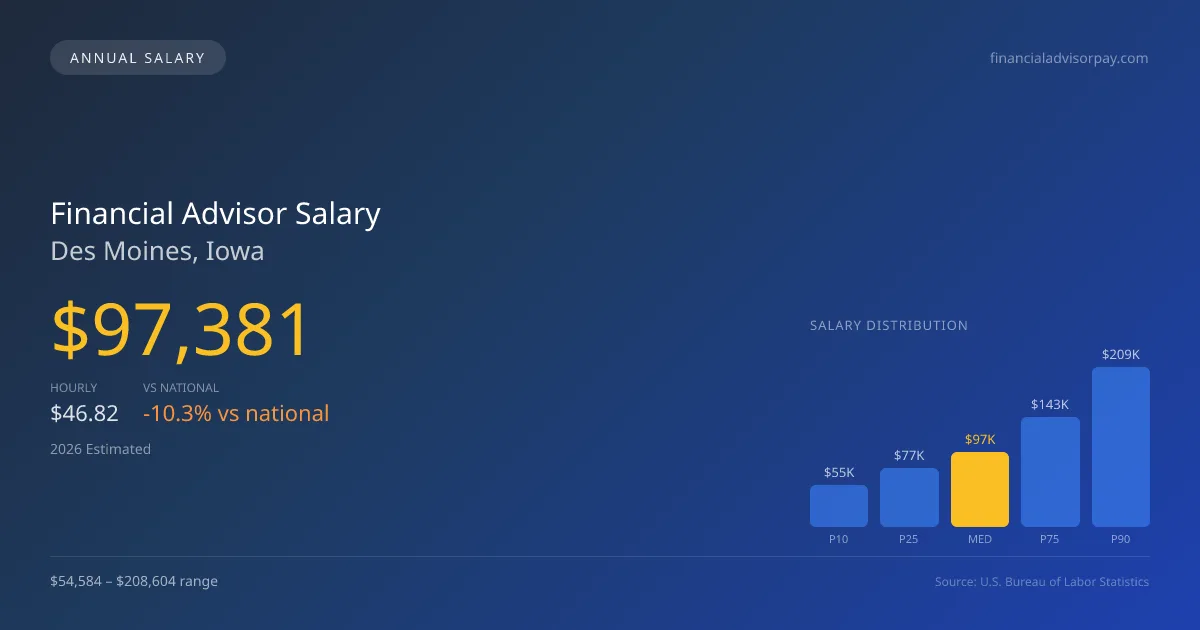
Financial advisors in Des Moines, Iowa are projected to earn a median annual salary of $97,381 in 2026, which is notably lower than the national median of $108,537. The financial advisor salary in Des Moines ranges from $54,584 at the 10th percentile to as much as $208,604 at the 90th percentile, revealing a significant disparity influenced by the structural divide between wirehouses and Registered Investment Advisors (RIAs). In this context, the assets under management (AUM) model plays a crucial role in dictating pay levels, with RIAs typically adopting a fee-based compensation structure that centers on asset growth rather than commissions tied to transactions. This shift impacts how much financial advisors can earn, contributing to the local market dynamics reported in the official Bureau of Labor Statistics (BLS) surveys.
Salary Breakdown
| Percentile | Annual | Hourly |
|---|---|---|
| Entry Level (P10) | $54,584 | $26.24 |
| Lower Range (P25) | $77,041 | $37.04 |
| Median (P50)(typical) | $97,381 | $46.82 |
| Upper Range (P75) | $143,009 | $68.76 |
| Top Earners (P90) | $208,604 | $100.29 |
Median Salary Position
10.28% below the national average
2026 Salary Percentile Distribution in Des Moines
In Des Moines, IA, the financial advisor salary spread from the 10th to 90th percentile is $154,020 (2026 est.). At $97,381, the local median is 10.28% below the national median of $108,537.
Salary Calculator
At 40 hours/week in Des Moines: You'd be in the lower-middle range
How Des Moines Financial Advisor Pay Compares
Des Moines median: $97,381/year (2026)
| Compared To | Median Salary | Des Moines Pays |
|---|---|---|
| Iowa Average | $95,006 | +2.50% more |
| National Average | $108,537 | -10.28% less |
Financial Advisors in Des Moines, IA earn a median of $97,381 per year (2026 est.), which is 10.28% lower than the national median of $108,537 and 2.50% above the Iowa state average of $95,006.
Cost-of-Living Adjusted Salary
Des Moines has a cost of living 8.30% below the national average, meaning your salary goes further here.
Adjusted salary = nominal × (100 / CoL index). CoL index: 100 = national average.
Des Moines, IA has a cost-of-living index of 91.701 (below the national average of 100). A financial advisor earning $97,381 nominally has purchasing power equivalent to $106,194 in an average-cost city — an effective 9.05% boost.
Compare Purchasing Power
Select a city to see how your salary compares after cost of living
Select a city above to compare purchasing power
2019 BLS Actual
$72,850
2025 BLS Actual
$94,270
2026 Current Est.
$97,381
2019–2027 Growth
+38.1%
Salary Trajectory for Financial Advisors in Des Moines (2019–2027)
2019–2025: actual BLS OEWS data for this metro area. 2026+: CAGR 3.30% projection.
| Year | Annual Salary | Status |
|---|---|---|
| 2019 | $72,850 | Actual |
| 2020 | $71,850 | Actual |
| 2021 | $81,020 | Actual |
| 2022 | $75,990 | Actual |
| 2023 | $78,320 | Actual |
| 2024 | $90,290 | Actual |
| 2025 | $94,270 | Actual |
| 2026(current) | $97,381 | Estimated |
| 2027 | $100,594 | Projected |
Based on 7 years of BLS OEWS data for the Des Moines metropolitan area, the median financial advisor salary grew 29.4% from $72,850 (2019) to $94,270 (2025). At a 3.30% compound annual growth rate, salaries are projected to reach $100,594 by 2027 — a total increase of $27,744 (38.08%) from 2019.
Note: Historical values (2019–2025) are actual BLS OEWS figures for the Des Moines metropolitan area, sourced from annual Occupational Employment and Wage Statistics surveys. 2026–2026 figures are current estimates, and 2027 values are projections, calculated using a 3.30% CAGR derived from 7-year BLS historical data. Actual salaries may vary based on employer, experience, certifications, and local market conditions.
Salary by Experience Level
| Experience | Estimated Salary Range |
|---|---|
| 0-2 years (New Graduate) | $54,584 – $77,041 |
| 3-5 years (Mid Career) | $77,041 – $97,381 |
| 5+ years (Experienced) | $97,381 – $143,009 |
| 10+ years (Top Earner) | $143,009 – $208,604 |
CFP, FA salary ranges estimated from BLS percentile data. Individual financial advisor compensation varies by employer, certifications, and specialization.
Financial Advisor Job Market in Des Moines
In Des Moines, the financial advisor job market features approximately 640 advisors, which contributes to a competitive hiring environment. Notably, the cost of living index, situated at 91.701, indicates that while salaries in the area are lower than the national average, advisors may experience a more favorable take-home pay relative to living expenses. Among local employers, wirehouses such as Morgan Stanley and Merrill Lynch generally offer some of the highest salaries, especially when compared to independent broker-dealers and RIAs. Factors like AUM book size, compensation model, and the concentration of high-net-worth clients directly affect the salary variance seen in the market. Those aiming to maximize financial advisor pay in Des Moines IA should prioritize obtaining recognized credentials like the CFP or CFA, focusing on client retention and growth strategies that enhance their book of business, especially in a landscape leaning towards fiduciary services.
More salary data for Des Moines, IA:
Frequently Asked Questions
How much do financial advisors make in Des Moines, IA in 2026?
Is Des Moines, IA a good place to work as a financial advisor?
Can financial advisors make $100K in Des Moines?
What is the cost-of-living adjusted financial advisor salary in Des Moines?
How much does a financial advisor make per hour in Des Moines?
Related Pages
Compare Salaries
Career Resources
Written by Jordan Lee, CFP
Career Analyst
Jordan has over 10 years of experience in financial planning. They specialize in retirement planning for individuals. They work at a financial services firm in New York City.
Methodology & Data Source
Salary figures on this page are 2026 projections based on the Bureau of Labor Statistics Occupational Employment and Wage Statistics (OEWS) survey, May 2026 release. The BLS reported a median annual salary of $94,270 for financial advisorsin the Des Moines metropolitan area. A 3.30% compound annual growth rate (CAGR), calculated from 6-year national BLS wage trends, was applied to project current 2026 compensation. Percentile ranges (P10–P90) represent the full salary distribution across experience levels and practice settings in this market.
Data Sources & Methodology
Source: BLS, OEWS, 7-year dataset (–). Per-city data from annual BLS metropolitan area surveys.
2026 figures are projected from 2025 BLS data using a compound annual growth rate (CAGR) of 3.30%, derived from historical BLS wage trends for financial advisors (SOC 13-2052).
Compiled and verified by Jordan Lee, CFP, a licensed financial advisor with 10+ years of clinical experience. · View source data at BLS.gov