Financial Advisor Salary in Richmond, IN: $78,817 (2026)
Quick Answer:A full-time financial advisor in Richmond, IN earns a median $78,817/year (≈ $37.89/hour) in nominal terms for 2026 — projected from BLS OEWS 2025 (SOC 13-2052). Once you factor in Richmond's price level (9% below national, BEA RPP 91.3), that paycheck buys what $86,327 would nationally. Nominal pay sits 2.7% below the Indiana state average.
Based on BLS state-level estimates · View source
With a projected median annual salary of $78,817 for financial advisors in Richmond, IN, this career path presents a steady income option in a market where fee-only fiduciary firms are gaining traction. Salaries range from $45,713 at the 10th percentile to $122,166 at the 90th percentile, indicating considerable variation based on experience and clientele. These figures are derived from local estimates based on 2025 BLS data, adjusted for regional cost considerations. Richmond's financial landscape offers opportunities for both new entrants and seasoned professionals eager to capitalize on the shift towards more transparent, client-centered compensation models, highlighted by the growing demand for Certified Financial Planners (CFP).
About the Richmond Market
Salary estimated from Indiana average ($88,000) adjusted for local cost of living.
Salary Breakdown
| Percentile | Annual | Hourly |
|---|---|---|
| Entry Level (P10) | $45,713 | $21.98 |
| Lower Range (P25) | $57,505 | $27.64 |
| Median (P50)(typical) | $78,817 | $37.89 |
| Upper Range (P75) | $100,886 | $48.50 |
| Top Earners (P90) | $122,166 | $58.74 |
Median Salary Position
27.38% below the national average
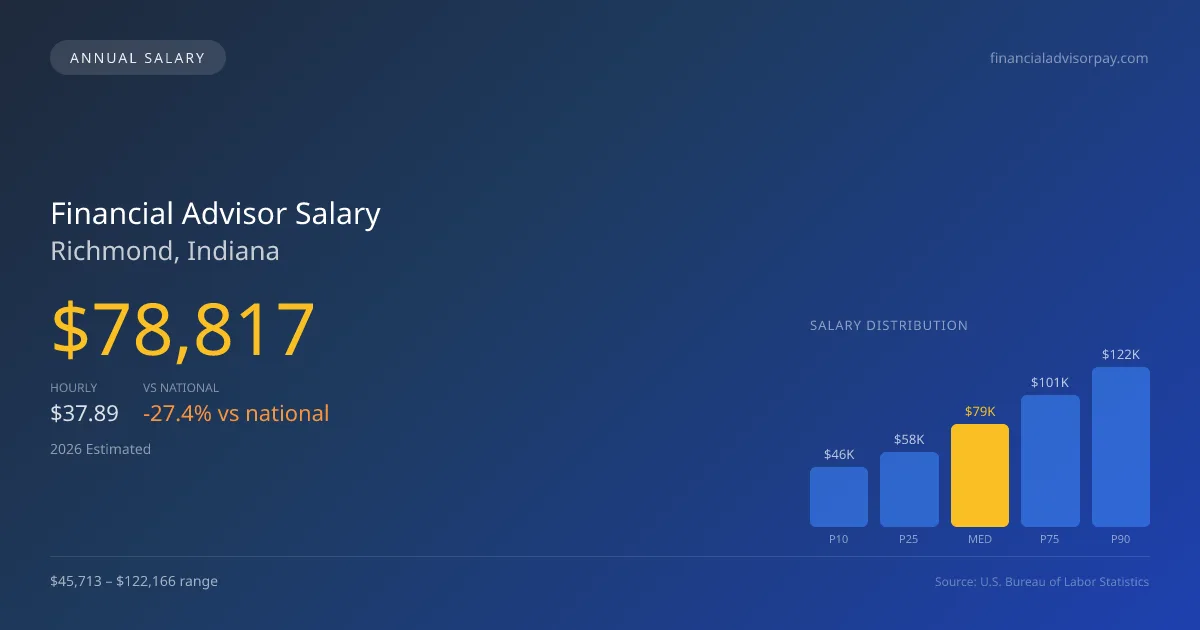
2026 Salary Percentile Distribution in Richmond
In Richmond, IN, the financial advisor salary spread from the 10th to 90th percentile is $76,453 (2026 est.). At $78,817, the local median is 27.38% below the national median of $108,537.
Salary Calculator
At 40 hours/week in Richmond: You'd be in the lower-middle range
How Richmond Financial Advisor Pay Compares
Richmond median: $78,817/year (2026)
| Compared To | Median Salary | Richmond Pays |
|---|---|---|
| Indiana Average | $81,004 | -2.70% less |
| National Average | $108,537 | -27.38% less |
Financial Advisors in Richmond, IN earn a median of $78,817 per year (2026 est.), which is 27.38% lower than the national median of $108,537 and 2.70% below the Indiana state average of $81,004.
Cost-of-Living Adjusted Salary
Richmond has a cost of living 8.70% below the national average, meaning your salary goes further here.
Adjusted salary = nominal × (100 / CoL index). CoL index: 100 = national average.
Richmond, IN has a cost-of-living index of 91.3 (below the national average of 100). A financial advisor earning $78,817 nominally has purchasing power equivalent to $86,327 in an average-cost city — an effective 9.53% boost.
Compare Purchasing Power
Select a city to see how your salary compares after cost of living
Select a city above to compare purchasing power
2019 BLS Actual
$63,794
2025 BLS Actual
$76,299
2026 Current Est.
$78,817
2019–2027 Growth
+27.6%
Salary Trajectory for Financial Advisors in Richmond (2019–2027)
2019–2025: actual BLS OEWS data for this metro area. 2026+: CAGR 3.30% projection.
| Year | Annual Salary | Status |
|---|---|---|
| 2019 | $63,794 | Actual |
| 2020 | $64,869 | Actual |
| 2021 | $68,384 | Actual |
| 2022 | $69,270 | Actual |
| 2023 | $72,312 | Actual |
| 2024 | $78,186 | Actual |
| 2025 | $76,299 | Actual |
| 2026(current) | $78,817 | Estimated |
| 2027 | $81,418 | Projected |
Based on 7 years of BLS OEWS data for the Richmond metropolitan area, the median financial advisor salary grew 19.6% from $63,794 (2019) to $76,299 (2025). At a 3.30% compound annual growth rate, salaries are projected to reach $81,418 by 2027 — a total increase of $17,624 (27.63%) from 2019.
Note: Historical values (2019–2025) are actual BLS OEWS figures for the Richmond metropolitan area, sourced from annual Occupational Employment and Wage Statistics surveys. 2026–2026 figures are current estimates, and 2027 values are projections, calculated using a 3.30% CAGR derived from 7-year BLS historical data. Actual salaries may vary based on employer, experience, certifications, and local market conditions.
Salary by Experience Level
| Experience | Estimated Salary Range |
|---|---|
| 0-2 years (New Graduate) | $45,713 – $57,505 |
| 3-5 years (Mid Career) | $57,505 – $78,817 |
| 5+ years (Experienced) | $78,817 – $100,886 |
| 10+ years (Top Earner) | $100,886 – $122,166 |
CFP, FA salary ranges estimated from BLS percentile data. Individual financial advisor compensation varies by employer, certifications, and specialization.
Financial Advisor Job Market in Richmond
In Richmond, the job market for financial advisors remains modest, with seven professionals currently employed in this sector. The area's cost of living index stands at 91.3, suggesting that financial advisors in Richmond may enjoy a favorable purchasing power relative to national averages. Among local employers, wirehouses such as Morgan Stanley and Wells Fargo Advisors tend to offer higher compensation, while independent broker-dealers and RIAs are increasingly appealing to fiduciary-minded candidates. The pay discrepancy often stems from asset under management (AUM) models where advisors at RIAs typically earn based on a percentage of client assets, compared to commission structures common at wirehouses. To enhance earning potential in Richmond, financial advisors should focus on building a robust client base, pursuing CFP certification, and considering models that emphasize fee-based structures rather than commission-based sales.
More salary data for Richmond, IN:
Frequently Asked Questions
How much do financial advisors make in Richmond, IN in 2026?
Is Richmond, IN a good place to work as a financial advisor?
Can financial advisors make $100K in Richmond?
What is the cost-of-living adjusted financial advisor salary in Richmond?
How much does a financial advisor make per hour in Richmond?
Related Pages
Compare Salaries
Career Resources
Nearby Cities in Indiana
Written by Jordan Lee, CFP
Career Analyst
Jordan has over 10 years of experience in financial planning. They specialize in retirement planning for individuals. They work at a financial services firm in New York City.
Methodology & Data Source
Salary figures on this page are 2026 projections based on the Bureau of Labor Statistics Occupational Employment and Wage Statistics (OEWS) survey, May 2026 release. The BLS reported a median annual salary of $76,299 for financial advisorsin the Richmond metropolitan area. A 3.30% compound annual growth rate (CAGR), calculated from 6-year national BLS wage trends, was applied to project current 2026 compensation. Percentile ranges (P10–P90) represent the full salary distribution across experience levels and practice settings in this market.
Data Sources & Methodology
Salary data for Richmond is estimated from official BLS state-level occupational wage data (2025), adjusted for regional cost-of-living differences using BEA RPP (Regional Price Parities).
2026 figures are projected from 2025 BLS data using a compound annual growth rate (CAGR) of 3.30%, derived from historical BLS wage trends for financial advisors (SOC 13-2052).
Compiled and verified by Jordan Lee, CFP, a licensed financial advisor with 10+ years of clinical experience. · View source data at BLS.gov