Financial Advisor Salary in Rockford, IL: $114,508 (2026)
Quick Answer:A full-time financial advisor in Rockford, IL earns a median $114,508/year (≈ $55.06/hour) in nominal terms for 2026 — projected from BLS OEWS 2025 (SOC 13-2052). Once you factor in Rockford's price level (8% below national, BEA RPP 92.2), that paycheck buys what $124,257 would nationally. Nominal pay sits 1.4% below the Illinois state average.
Official BLS data · View source
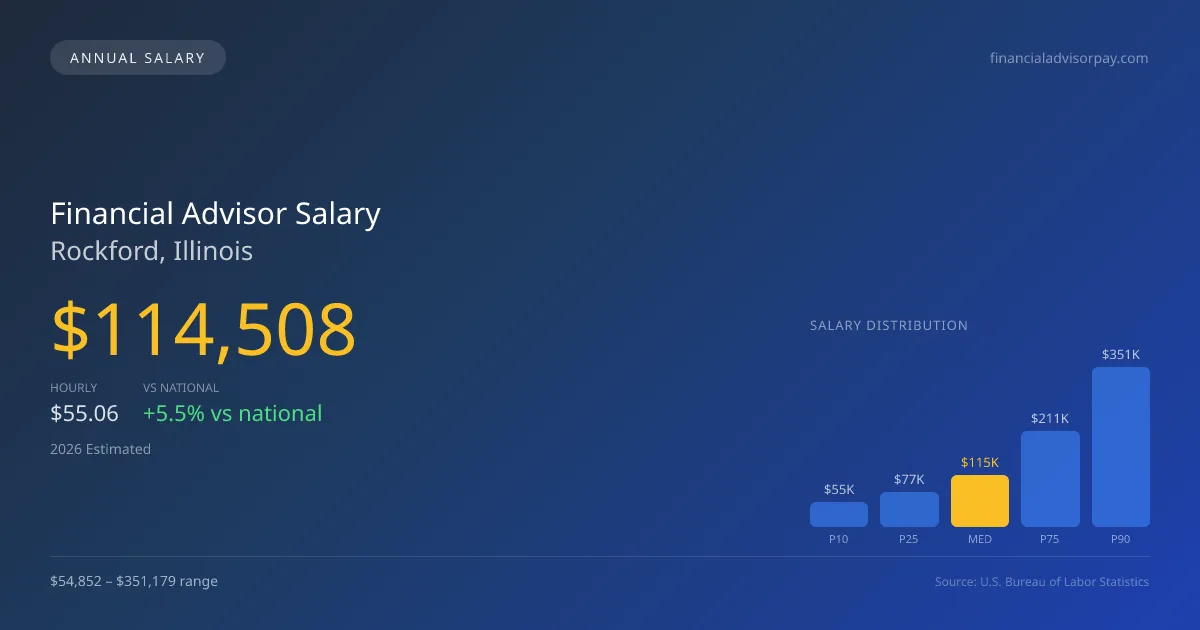
In 2026, financial advisors in Rockford, Illinois, can expect to see a median annual salary of $114,508, slightly above the national median of $108,537. The salary range indicates significant variability in income, with lower earners starting at approximately $54,852 and high achievers potentially reaching up to $351,179. These figures, derived from official Bureau of Labor Statistics (BLS) occupational data, highlight the ongoing trend toward fee-only advisory services and the increasing value placed on Certified Financial Planner (CFP) credentials. Given the local market's growth rate of 3.30%, Rockford presents an evolving landscape for financial advisory practices, suggesting continued demand for skilled professionals in this sector.
Salary Breakdown
| Percentile | Annual | Hourly |
|---|---|---|
| Entry Level (P10) | $54,852 | $26.37 |
| Lower Range (P25) | $77,237 | $37.14 |
| Median (P50)(typical) | $114,508 | $55.06 |
| Upper Range (P75) | $211,114 | $101.50 |
| Top Earners (P90) | $351,179 | $168.83 |
Median Salary Position
5.50% above the national average
2026 Salary Percentile Distribution in Rockford
In Rockford, IL, the financial advisor salary spread from the 10th to 90th percentile is $296,327 (2026 est.). At $114,508, the local median is 5.5% above the national median of $108,537.
Salary Calculator
At 40 hours/week in Rockford: You'd be in the entry-level range
How Rockford Financial Advisor Pay Compares
Rockford median: $114,508/year (2026)
| Compared To | Median Salary | Rockford Pays |
|---|---|---|
| Illinois Average | $116,134 | -1.40% less |
| National Average | $108,537 | +5.50% more |
Financial Advisors in Rockford, IL earn a median of $114,508 per year (2026 est.), which is 5.50% higher than the national median of $108,537 and 1.40% below the Illinois state average of $116,134.
Cost-of-Living Adjusted Salary
Rockford has a cost of living 7.85% below the national average, meaning your salary goes further here.
Adjusted salary = nominal × (100 / CoL index). CoL index: 100 = national average.
Rockford, IL has a cost-of-living index of 92.154 (below the national average of 100). A financial advisor earning $114,508 nominally has purchasing power equivalent to $124,257 in an average-cost city — an effective 8.51% boost.
Compare Purchasing Power
Select a city to see how your salary compares after cost of living
Select a city above to compare purchasing power
2019 BLS Actual
$75,040
2025 BLS Actual
$110,850
2026 Current Est.
$114,508
2019–2027 Growth
+57.6%
Salary Trajectory for Financial Advisors in Rockford (2019–2027)
2019–2025: actual BLS OEWS data for this metro area. 2026+: CAGR 3.30% projection.
| Year | Annual Salary | Status |
|---|---|---|
| 2019 | $75,040 | Actual |
| 2020 | $75,850 | Actual |
| 2021 | $95,480 | Actual |
| 2022 | $80,960 | Actual |
| 2023 | $82,860 | Actual |
| 2024 | $86,100 | Actual |
| 2025 | $110,850 | Actual |
| 2026(current) | $114,508 | Estimated |
| 2027 | $118,287 | Projected |
Based on 7 years of BLS OEWS data for the Rockford metropolitan area, the median financial advisor salary grew 47.7% from $75,040 (2019) to $110,850 (2025). At a 3.30% compound annual growth rate, salaries are projected to reach $118,287 by 2027 — a total increase of $43,247 (57.63%) from 2019.
Note: Historical values (2019–2025) are actual BLS OEWS figures for the Rockford metropolitan area, sourced from annual Occupational Employment and Wage Statistics surveys. 2026–2026 figures are current estimates, and 2027 values are projections, calculated using a 3.30% CAGR derived from 7-year BLS historical data. Actual salaries may vary based on employer, experience, certifications, and local market conditions.
Salary by Experience Level
| Experience | Estimated Salary Range |
|---|---|
| 0-2 years (New Graduate) | $54,852 – $77,237 |
| 3-5 years (Mid Career) | $77,237 – $114,508 |
| 5+ years (Experienced) | $114,508 – $211,114 |
| 10+ years (Top Earner) | $211,114 – $351,179 |
CFP, FA salary ranges estimated from BLS percentile data. Individual financial advisor compensation varies by employer, certifications, and specialization.
Financial Advisor Job Market in Rockford
Rockford currently employs around 90 financial advisors, reflecting a stable yet competitive market where expertise is highly valued. The cost of living index in the city is 92.154, indicating that advisors’ salaries can afford a comfortable lifestyle without the pressures found in other urban centers. Among the highest-paying employers are well-established wirehouses such as Morgan Stanley and Merrill Lynch, as well as fee-only advisories that cater to a high-net-worth clientele. The disparity in financial advisor pay in Rockford can be attributed to various factors such as the size of assets under management, the fee model employed, and the concentration of high-net-worth clients. To maximize earning potential, aspiring advisors should consider obtaining a CFP designation, developing a robust client network, and exploring opportunities at independent RIAs or wirehouses that offer transition packages for new advisors. This strategic approach may lead to better financial advisor pay in Rockford, IL.
More salary data for Rockford, IL:
Frequently Asked Questions
How much do financial advisors make in Rockford, IL in 2026?
Is Rockford, IL a good place to work as a financial advisor?
Can financial advisors make $100K in Rockford?
What is the cost-of-living adjusted financial advisor salary in Rockford?
How much does a financial advisor make per hour in Rockford?
Related Pages
Compare Salaries
Career Resources
Nearby Cities in Illinois
Written by Jordan Lee, CFP
Career Analyst
Jordan has over 10 years of experience in financial planning. They specialize in retirement planning for individuals. They work at a financial services firm in New York City.
Methodology & Data Source
Salary figures on this page are 2026 projections based on the Bureau of Labor Statistics Occupational Employment and Wage Statistics (OEWS) survey, May 2026 release. The BLS reported a median annual salary of $110,850 for financial advisorsin the Rockford metropolitan area. A 3.30% compound annual growth rate (CAGR), calculated from 6-year national BLS wage trends, was applied to project current 2026 compensation. Percentile ranges (P10–P90) represent the full salary distribution across experience levels and practice settings in this market.
Data Sources & Methodology
Source: BLS, OEWS, 7-year dataset (–). Per-city data from annual BLS metropolitan area surveys.
2026 figures are projected from 2025 BLS data using a compound annual growth rate (CAGR) of 3.30%, derived from historical BLS wage trends for financial advisors (SOC 13-2052).
Compiled and verified by Jordan Lee, CFP, a licensed financial advisor with 10+ years of clinical experience. · View source data at BLS.gov