Financial Advisor Salary in Cicero, IL: $112,363 (2026)
Quick Answer:A full-time financial advisor in Cicero, IL earns a median $112,363/year (≈ $54.02/hour) in nominal terms for 2026 — projected from BLS OEWS 2025 (SOC 13-2052). Once you factor in Cicero's price level (3% below national, BEA RPP 97.1), that paycheck buys what $115,719 would nationally. Nominal pay sits 3.2% below the Illinois state average.
Based on BLS state-level estimates · View source
Cicero is projected to have a median financial advisor salary of $112,363 in 2026, reflecting a competitive position just above the national median of $108,537. The salary range for financial advisors here spans from $65,170 at the 10th percentile to an impressive $174,162 for the 90th percentile, indicating substantial variability based on factors such as experience and client base. These figures are derived from estimates based on 2025 BLS data, adjusted for the regional cost of living in Cicero, IL, which has a cost of living index of 97.1. This range highlights the dynamic nature of compensation in the area, as the industry continues to evolve with many advisors considering independence to leverage long-term financial potential and client relationships.
About the Cicero Market
Salary estimated from Illinois average ($115,000) adjusted for local cost of living.
Salary Breakdown
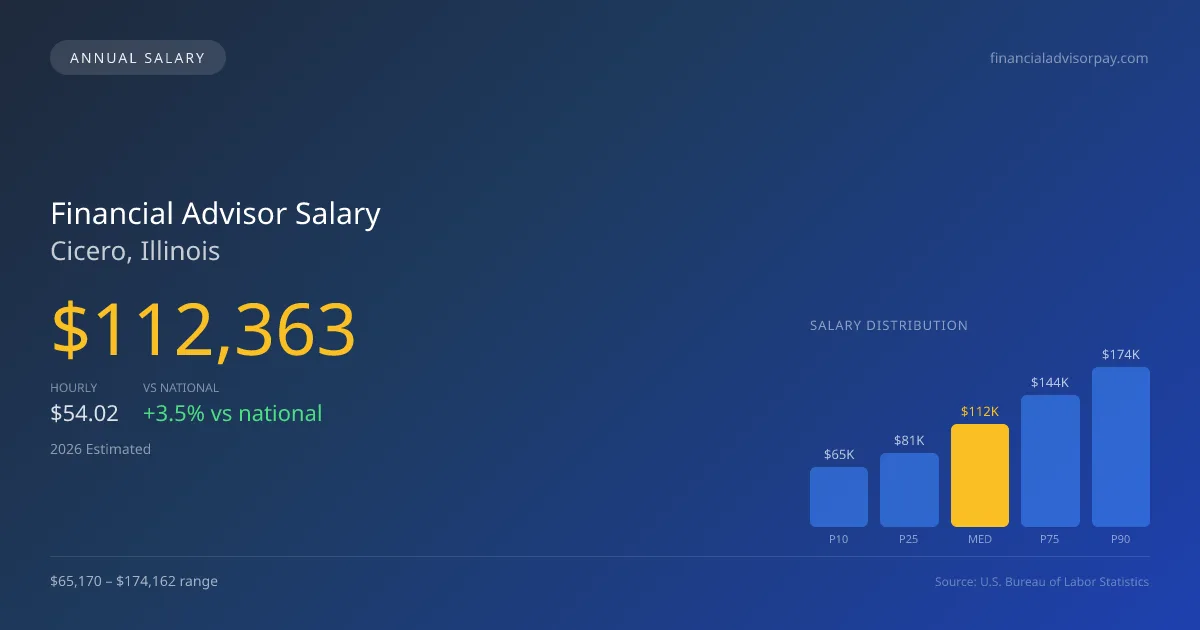
| Percentile | Annual | Hourly |
|---|---|---|
| Entry Level (P10) | $65,170 | $31.33 |
| Lower Range (P25) | $80,901 | $38.89 |
| Median (P50)(typical) | $112,363 | $54.02 |
| Upper Range (P75) | $143,824 | $69.15 |
| Top Earners (P90) | $174,162 | $83.73 |
Median Salary Position
3.53% above the national average
2026 Salary Percentile Distribution in Cicero
In Cicero, IL, the financial advisor salary spread from the 10th to 90th percentile is $108,992 (2026 est.). At $112,363, the local median is 3.53% above the national median of $108,537.
Salary Calculator
At 40 hours/week in Cicero: You'd be in the lower-middle range
How Cicero Financial Advisor Pay Compares
Cicero median: $112,363/year (2026)
| Compared To | Median Salary | Cicero Pays |
|---|---|---|
| Illinois Average | $116,077 | -3.20% less |
| National Average | $108,537 | +3.53% more |
Financial Advisors in Cicero, IL earn a median of $112,363 per year (2026 est.), which is 3.53% higher than the national median of $108,537 and 3.20% below the Illinois state average of $116,077.
Cost-of-Living Adjusted Salary
Cicero has a cost of living 2.90% below the national average, meaning your salary goes further here.
Adjusted salary = nominal × (100 / CoL index). CoL index: 100 = national average.
Cicero, IL has a cost-of-living index of 97.1 (below the national average of 100). A financial advisor earning $112,363 nominally has purchasing power equivalent to $115,719 in an average-cost city — an effective 2.99% boost.
Compare Purchasing Power
Select a city to see how your salary compares after cost of living
Select a city above to compare purchasing power
2019 BLS Actual
$90,946
2025 BLS Actual
$108,773
2026 Current Est.
$112,363
2019–2027 Growth
+27.6%
Salary Trajectory for Financial Advisors in Cicero (2019–2027)
2019–2025: actual BLS OEWS data for this metro area. 2026+: CAGR 3.30% projection.
| Year | Annual Salary | Status |
|---|---|---|
| 2019 | $90,946 | Actual |
| 2020 | $92,478 | Actual |
| 2021 | $97,489 | Actual |
| 2022 | $98,752 | Actual |
| 2023 | $103,090 | Actual |
| 2024 | $108,085 | Actual |
| 2025 | $108,773 | Actual |
| 2026(current) | $112,363 | Estimated |
| 2027 | $116,070 | Projected |
Based on 7 years of BLS OEWS data for the Cicero metropolitan area, the median financial advisor salary grew 19.6% from $90,946 (2019) to $108,773 (2025). At a 3.30% compound annual growth rate, salaries are projected to reach $116,070 by 2027 — a total increase of $25,124 (27.63%) from 2019.
Note: Historical values (2019–2025) are actual BLS OEWS figures for the Cicero metropolitan area, sourced from annual Occupational Employment and Wage Statistics surveys. 2026–2026 figures are current estimates, and 2027 values are projections, calculated using a 3.30% CAGR derived from 7-year BLS historical data. Actual salaries may vary based on employer, experience, certifications, and local market conditions.
Salary by Experience Level
| Experience | Estimated Salary Range |
|---|---|
| 0-2 years (New Graduate) | $65,170 – $80,901 |
| 3-5 years (Mid Career) | $80,901 – $112,363 |
| 5+ years (Experienced) | $112,363 – $143,824 |
| 10+ years (Top Earner) | $143,824 – $174,162 |
CFP, FA salary ranges estimated from BLS percentile data. Individual financial advisor compensation varies by employer, certifications, and specialization.
Financial Advisor Job Market in Cicero
In Cicero, there are currently 21 financial advisors employed, underscoring a modest but stable job market in this field. The cost of living index suggests that while salaries may feel lower compared to some urban areas, they provide a reasonable standard of living for those in financial advisory roles. Major employers such as wirehouses like Morgan Stanley and Merrill Lynch typically offer higher initial pay, while independent registered investment advisors (RIAs) can achieve substantial earnings based on assets under management and client retention strategies. The difference in compensation can often be traced back to advisor credentials, with those holding CFP or CFA designations commanding higher pay. As a strategy for maximizing earnings in Cicero, new advisors should focus on building a robust client roster and considering the merits of fee structures over commission-based models, which may lead to a more stable revenue stream in the long run.
More salary data for Cicero, IL:
Frequently Asked Questions
How much do financial advisors make in Cicero, IL in 2026?
Is Cicero, IL a good place to work as a financial advisor?
Can financial advisors make $100K in Cicero?
What is the cost-of-living adjusted financial advisor salary in Cicero?
How much does a financial advisor make per hour in Cicero?
Related Pages
Compare Salaries
Career Resources
Nearby Cities in Illinois
Written by Jordan Lee, CFP
Career Analyst
Jordan has over 10 years of experience in financial planning. They specialize in retirement planning for individuals. They work at a financial services firm in New York City.
Methodology & Data Source
Salary figures on this page are 2026 projections based on the Bureau of Labor Statistics Occupational Employment and Wage Statistics (OEWS) survey, May 2026 release. The BLS reported a median annual salary of $108,773 for financial advisorsin the Cicero metropolitan area. A 3.30% compound annual growth rate (CAGR), calculated from 6-year national BLS wage trends, was applied to project current 2026 compensation. Percentile ranges (P10–P90) represent the full salary distribution across experience levels and practice settings in this market.
Data Sources & Methodology
Salary data for Cicero is estimated from official BLS state-level occupational wage data (2025), adjusted for regional cost-of-living differences using BEA RPP (Regional Price Parities).
2026 figures are projected from 2025 BLS data using a compound annual growth rate (CAGR) of 3.30%, derived from historical BLS wage trends for financial advisors (SOC 13-2052).
Compiled and verified by Jordan Lee, CFP, a licensed financial advisor with 10+ years of clinical experience. · View source data at BLS.gov