Financial Advisor Salary in Ocala, FL: $86,328 (2026)
Quick Answer:A full-time financial advisor in Ocala, FL earns a median $86,328/year (≈ $41.51/hour) in nominal terms for 2026 — projected from BLS OEWS 2025 (SOC 13-2052). Once you factor in Ocala's price level (5% below national, BEA RPP 95.2), that paycheck buys what $90,648 would nationally. Nominal pay sits 13.1% below the Florida state average.
Official BLS data · View source
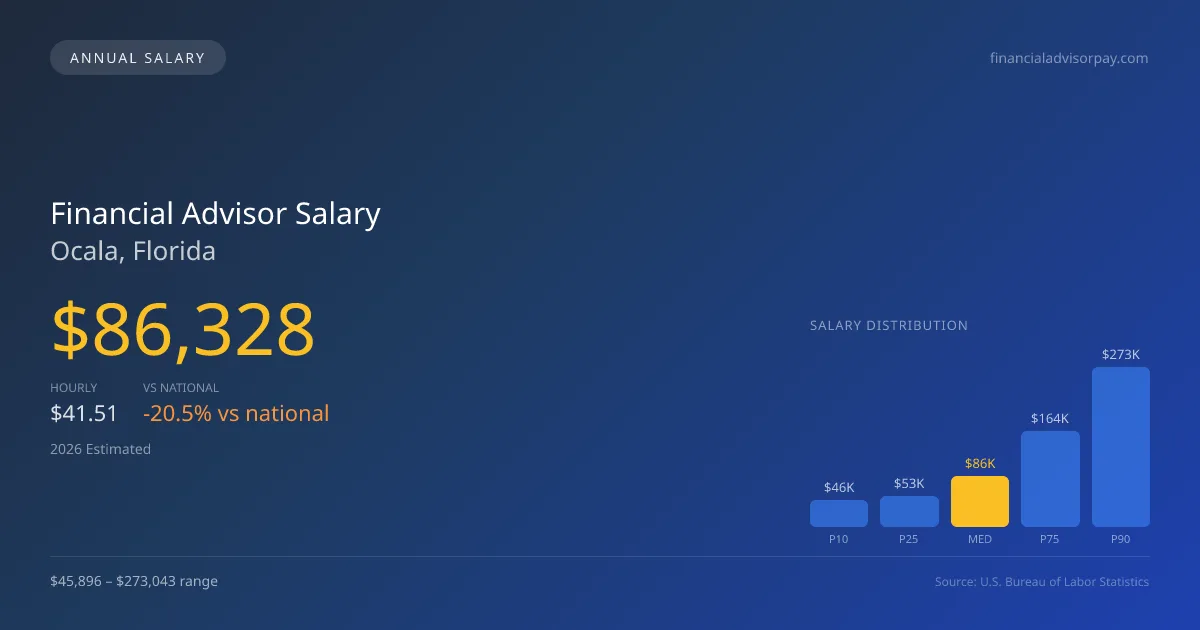
In Ocala, Florida, financial advisors can expect to earn a median annual salary of $86,328 in 2026, a figure that reflects a substantial gap when compared to the national median of $108,537. This local figure indicates a notable 20.46% difference, revealing the challenges within the job market for financial advisors in the area. The salary range for these professionals is broad, spanning from $45,896 at the 10th percentile to an impressive $273,043 at the 90th percentile. This disparity is largely driven by the structural divide between wirehouse models and RIA (Registered Investment Advisor) fiduciaries, with compensation often being influenced by the assets under management (AUM) and the fee models employed. Understanding these nuances is essential for aspiring financial professionals looking to succeed in Ocala's competitive environment.
Salary Breakdown
| Percentile | Annual | Hourly |
|---|---|---|
| Entry Level (P10) | $45,896 | $22.06 |
| Lower Range (P25) | $52,745 | $25.36 |
| Median (P50)(typical) | $86,328 | $41.51 |
| Upper Range (P75) | $163,772 | $78.74 |
| Top Earners (P90) | $273,043 | $131.27 |
Median Salary Position
20.46% below the national average
2026 Salary Percentile Distribution in Ocala
In Ocala, FL, the financial advisor salary spread from the 10th to 90th percentile is $227,147 (2026 est.). At $86,328, the local median is 20.46% below the national median of $108,537.
Salary Calculator
At 40 hours/week in Ocala: You'd be in the entry-level range
How Ocala Financial Advisor Pay Compares
Ocala median: $86,328/year (2026)
| Compared To | Median Salary | Ocala Pays |
|---|---|---|
| Florida Average | $99,342 | -13.10% less |
| National Average | $108,537 | -20.46% less |
Financial Advisors in Ocala, FL earn a median of $86,328 per year (2026 est.), which is 20.46% lower than the national median of $108,537 and 13.10% below the Florida state average of $99,342.
Cost-of-Living Adjusted Salary
Ocala has a cost of living 4.77% below the national average, meaning your salary goes further here.
Adjusted salary = nominal × (100 / CoL index). CoL index: 100 = national average.
Ocala, FL has a cost-of-living index of 95.234 (below the national average of 100). A financial advisor earning $86,328 nominally has purchasing power equivalent to $90,648 in an average-cost city — an effective 5% boost.
Compare Purchasing Power
Select a city to see how your salary compares after cost of living
Select a city above to compare purchasing power
2019 BLS Actual
$42,200
2025 BLS Actual
$83,570
2026 Current Est.
$86,328
2019–2027 Growth
+111.3%
Salary Trajectory for Financial Advisors in Ocala (2019–2027)
2019–2025: actual BLS OEWS data for this metro area. 2026+: CAGR 3.30% projection.
| Year | Annual Salary | Status |
|---|---|---|
| 2019 | $42,200 | Actual |
| 2020 | $46,940 | Actual |
| 2021 | $59,890 | Actual |
| 2022 | $52,300 | Actual |
| 2023 | $77,140 | Actual |
| 2024 | $68,630 | Actual |
| 2025 | $83,570 | Actual |
| 2026(current) | $86,328 | Estimated |
| 2027 | $89,177 | Projected |
Based on 7 years of BLS OEWS data for the Ocala metropolitan area, the median financial advisor salary grew 98.0% from $42,200 (2019) to $83,570 (2025). At a 3.30% compound annual growth rate, salaries are projected to reach $89,177 by 2027 — a total increase of $46,977 (111.32%) from 2019.
Note: Historical values (2019–2025) are actual BLS OEWS figures for the Ocala metropolitan area, sourced from annual Occupational Employment and Wage Statistics surveys. 2026–2026 figures are current estimates, and 2027 values are projections, calculated using a 3.30% CAGR derived from 7-year BLS historical data. Actual salaries may vary based on employer, experience, certifications, and local market conditions.
Salary by Experience Level
| Experience | Estimated Salary Range |
|---|---|
| 0-2 years (New Graduate) | $45,896 – $52,745 |
| 3-5 years (Mid Career) | $52,745 – $86,328 |
| 5+ years (Experienced) | $86,328 – $163,772 |
| 10+ years (Top Earner) | $163,772 – $273,043 |
CFP, FA salary ranges estimated from BLS percentile data. Individual financial advisor compensation varies by employer, certifications, and specialization.
Financial Advisor Job Market in Ocala
The job market in Ocala features approximately 150 financial advisors, a workforce that reflects both opportunity and competition. The local cost of living, indexed at 95.234, enhances the attractiveness of these salaries as they generally exceed expenses, allowing for better take-home purchasing power. Among the various employers, wirehouse firms such as Morgan Stanley and Merrill Lynch typically offer higher compensation packages compared to independent broker-dealers or RIAs. Factors contributing to compensation variations include the size of an advisor's AUM book, the difference between fiduciary and commission-based fee structures, and the presence of high-net-worth clients. Advisors can boost their earning potential by cultivating diverse client bases, obtaining advanced credentials like the CFP or CFA, and exploring partnerships within RIAs, which often include profit-sharing opportunities. This combination of strategies is vital for maximizing financial advisor pay in Ocala, FL, where both national trends and local dynamics shape the earnings landscape.
More salary data for Ocala, FL:
Frequently Asked Questions
How much do financial advisors make in Ocala, FL in 2026?
Is Ocala, FL a good place to work as a financial advisor?
Can financial advisors make $100K in Ocala?
What is the cost-of-living adjusted financial advisor salary in Ocala?
How much does a financial advisor make per hour in Ocala?
Related Pages
Compare Salaries
Career Resources
Nearby Cities in Florida
Written by Jordan Lee, CFP
Career Analyst
Jordan has over 10 years of experience in financial planning. They specialize in retirement planning for individuals. They work at a financial services firm in New York City.
Methodology & Data Source
Salary figures on this page are 2026 projections based on the Bureau of Labor Statistics Occupational Employment and Wage Statistics (OEWS) survey, May 2026 release. The BLS reported a median annual salary of $83,570 for financial advisorsin the Ocala metropolitan area. A 3.30% compound annual growth rate (CAGR), calculated from 6-year national BLS wage trends, was applied to project current 2026 compensation. Percentile ranges (P10–P90) represent the full salary distribution across experience levels and practice settings in this market.
Data Sources & Methodology
Source: BLS, OEWS, 7-year dataset (–). Per-city data from annual BLS metropolitan area surveys.
2026 figures are projected from 2025 BLS data using a compound annual growth rate (CAGR) of 3.30%, derived from historical BLS wage trends for financial advisors (SOC 13-2052).
Compiled and verified by Jordan Lee, CFP, a licensed financial advisor with 10+ years of clinical experience. · View source data at BLS.gov