Financial Advisor Salary in Washington, DC: $109,736 (2026)
Quick Answer:A full-time financial advisor in Washington, DC earns a median $109,736/year (≈ $52.76/hour) in nominal terms for 2026 — projected from BLS OEWS 2025 (SOC 13-2052). Once you factor in Washington's price level (9% above national, BEA RPP 108.9), that paycheck buys what $100,782 would nationally. Nominal pay sits 13.6% below the District of Columbia state average.
Official BLS data · View source
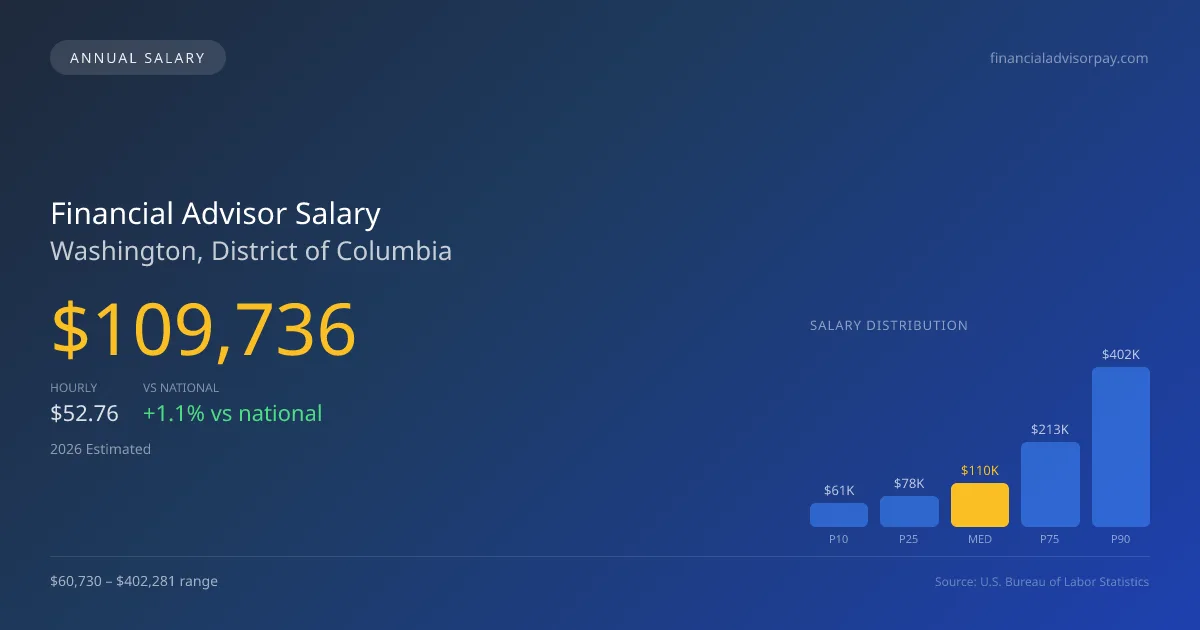
In Washington, DC, financial advisors can expect a 2026 median annual salary of $109,736, which surpasses the national median of $108,537 by a slight margin. The salary range for these professionals varies significantly, from $60,730 at the lower end to a remarkable $402,281 for top earners. This compensation landscape reflects the bifurcation in the industry between commission-based wirehouse firms and fee-only Registered Investment Advisors (RIAs) that commonly use an assets under management (AUM) fee model. As firms continue adapting to regulatory pressures and market conditions, the compensation structure will increasingly favor those who prioritize fiduciary duties, thereby impacting the earning potential for financial advisors in Washington.
Salary Breakdown
| Percentile | Annual | Hourly |
|---|---|---|
| Entry Level (P10) | $60,730 | $29.20 |
| Lower Range (P25) | $78,033 | $37.52 |
| Median (P50)(typical) | $109,736 | $52.76 |
| Upper Range (P75) | $212,994 | $102.40 |
| Top Earners (P90) | $402,281 | $193.41 |
Median Salary Position
1.10% above the national average
2026 Salary Percentile Distribution in Washington
In Washington, DC, the financial advisor salary spread from the 10th to 90th percentile is $341,551 (2026 est.). At $109,736, the local median is 1.1% above the national median of $108,537.
Salary Calculator
At 40 hours/week in Washington: You'd be in the entry-level range
How Washington Financial Advisor Pay Compares
Washington median: $109,736/year (2026)
| Compared To | Median Salary | Washington Pays |
|---|---|---|
| District of Columbia Average | $127,009 | -13.60% less |
| National Average | $108,537 | +1.10% more |
Financial Advisors in Washington, DC earn a median of $109,736 per year (2026 est.), which is 1.10% higher than the national median of $108,537 and 13.60% below the District of Columbia state average of $127,009.
Cost-of-Living Adjusted Salary
Washington has a cost of living 8.88% above the national average.
Adjusted salary = nominal × (100 / CoL index). CoL index: 100 = national average.
Washington, DC has a cost-of-living index of 108.884 (above the national average of 100). While the nominal salary of $109,736 is competitive, the higher cost of living reduces purchasing power to an effective $100,782 — a 8.16% reduction.
Compare Purchasing Power
Select a city to see how your salary compares after cost of living
Select a city above to compare purchasing power
2019 BLS Actual
$85,850
2025 BLS Actual
$106,230
2026 Current Est.
$109,736
2019–2027 Growth
+32.0%
Salary Trajectory for Financial Advisors in Washington (2019–2027)
2019–2025: actual BLS OEWS data for this metro area. 2026+: CAGR 3.30% projection.
| Year | Annual Salary | Status |
|---|---|---|
| 2019 | $85,850 | Actual |
| 2020 | $82,740 | Actual |
| 2021 | $101,170 | Actual |
| 2022 | $89,980 | Actual |
| 2023 | $103,700 | Actual |
| 2024 | $109,520 | Actual |
| 2025 | $106,230 | Actual |
| 2026(current) | $109,736 | Estimated |
| 2027 | $113,357 | Projected |
Based on 7 years of BLS OEWS data for the Washington metropolitan area, the median financial advisor salary grew 23.7% from $85,850 (2019) to $106,230 (2025). At a 3.30% compound annual growth rate, salaries are projected to reach $113,357 by 2027 — a total increase of $27,507 (32.04%) from 2019.
Note: Historical values (2019–2025) are actual BLS OEWS figures for the Washington metropolitan area, sourced from annual Occupational Employment and Wage Statistics surveys. 2026–2026 figures are current estimates, and 2027 values are projections, calculated using a 3.30% CAGR derived from 7-year BLS historical data. Actual salaries may vary based on employer, experience, certifications, and local market conditions.
Salary by Experience Level
| Experience | Estimated Salary Range |
|---|---|
| 0-2 years (New Graduate) | $60,730 – $78,033 |
| 3-5 years (Mid Career) | $78,033 – $109,736 |
| 5+ years (Experienced) | $109,736 – $212,994 |
| 10+ years (Top Earner) | $212,994 – $402,281 |
CFP, FA salary ranges estimated from BLS percentile data. Individual financial advisor compensation varies by employer, certifications, and specialization.
Financial Advisor Job Market in Washington
As of the latest projection, the financial advisory sector in Washington employs approximately 4,330 individuals, suggesting a robust job market for aspiring financial planners. However, the local cost of living presents challenges, with a cost of living index at 108.884, meaning that take-home salaries must cover higher expenses. Among employers, wirehouses like Morgan Stanley and Merrill Lynch tend to offer competitive pay but often rely on commission structures, while RIAs attract advisors with potential higher earnings based on client assets. The income disparity within this profession can often stem from factors such as the AUM book size, clients’ high net worth concentrations, and the prestige associated with advanced credentials like the CFP or CFA. For those looking to enhance their financial advisor pay in Washington, focusing on building a substantial client base, obtaining recognized qualifications, and exploring opportunities with RIAs may yield the best results.
More salary data for Washington, DC:
Frequently Asked Questions
How much do financial advisors make in Washington, DC in 2026?
Is Washington, DC a good place to work as a financial advisor?
Can financial advisors make $100K in Washington?
What is the cost-of-living adjusted financial advisor salary in Washington?
How much does a financial advisor make per hour in Washington?
Related Pages
Career Resources
Written by Jordan Lee, CFP
Career Analyst
Jordan has over 10 years of experience in financial planning. They specialize in retirement planning for individuals. They work at a financial services firm in New York City.
Methodology & Data Source
Salary figures on this page are 2026 projections based on the Bureau of Labor Statistics Occupational Employment and Wage Statistics (OEWS) survey, May 2026 release. The BLS reported a median annual salary of $106,230 for financial advisorsin the Washington metropolitan area. A 3.30% compound annual growth rate (CAGR), calculated from 6-year national BLS wage trends, was applied to project current 2026 compensation. Percentile ranges (P10–P90) represent the full salary distribution across experience levels and practice settings in this market.
Data Sources & Methodology
Source: BLS, OEWS, 7-year dataset (–). Per-city data from annual BLS metropolitan area surveys.
2026 figures are projected from 2025 BLS data using a compound annual growth rate (CAGR) of 3.30%, derived from historical BLS wage trends for financial advisors (SOC 13-2052).
Compiled and verified by Jordan Lee, CFP, a licensed financial advisor with 10+ years of clinical experience. · View source data at BLS.gov