Financial Advisor Salary in Stockton, CA: $99,003 (2026)
Quick Answer:A full-time financial advisor in Stockton, CA earns a median $99,003/year (≈ $47.60/hour) in nominal terms for 2026 — projected from BLS OEWS 2025 (SOC 13-2052). Once you factor in Stockton's price level (5% above national, BEA RPP 105.1), that paycheck buys what $94,209 would nationally. Nominal pay sits 14.1% below the California state average.
Official BLS data · View source
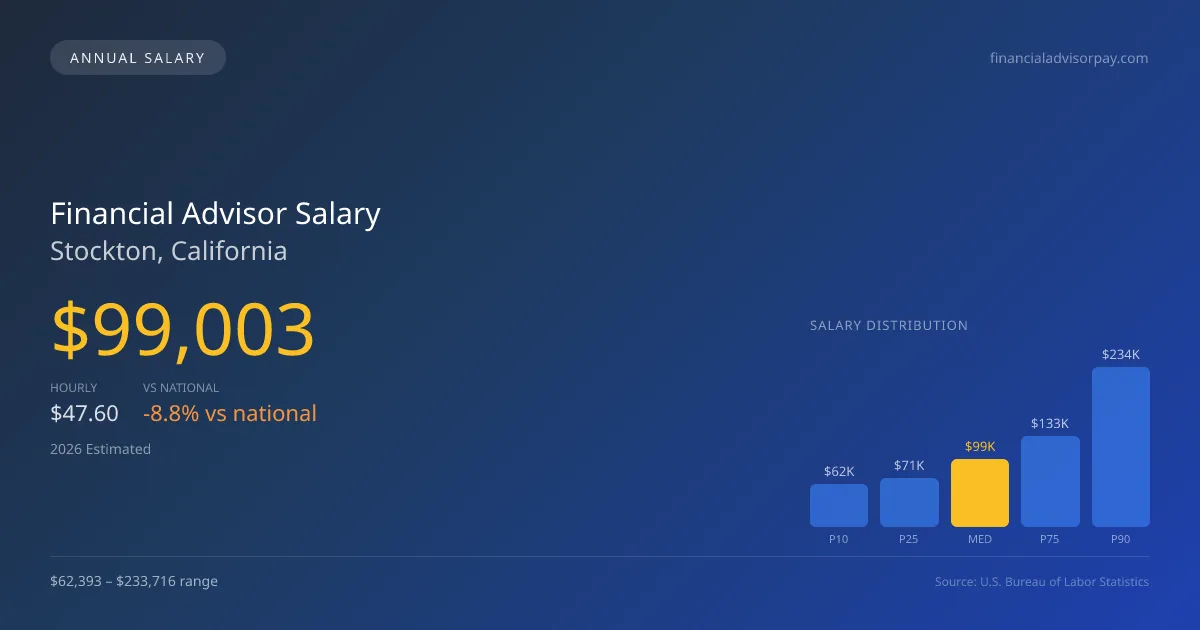
With a median annual salary of $99,003 projected for 2026, financial advisors in Stockton, California, find themselves in a competitive earning landscape. The salary range reflects considerable variability, with entry-level positions starting at $62,393 and seasoned advisors potentially reaching up to $233,716. This data, derived from the official Bureau of Labor Statistics (BLS) OEWS surveys, indicates that while local compensation may trail the national median of $108,537 by 8.78%, Stockton's financial market provides ample opportunities for growth. The expected 3.30% annual growth rate over the next five years suggests a positive trajectory for financial advisor positions as the local demand for sound financial planning escalates.
Salary Breakdown
| Percentile | Annual | Hourly |
|---|---|---|
| Entry Level (P10) | $62,393 | $30.00 |
| Lower Range (P25) | $71,277 | $34.26 |
| Median (P50)(typical) | $99,003 | $47.60 |
| Upper Range (P75) | $133,236 | $64.06 |
| Top Earners (P90) | $233,716 | $112.37 |
Median Salary Position
8.78% below the national average
2026 Salary Percentile Distribution in Stockton
In Stockton, CA, the financial advisor salary spread from the 10th to 90th percentile is $171,323 (2026 est.). At $99,003, the local median is 8.78% below the national median of $108,537.
Salary Calculator
At 40 hours/week in Stockton: You'd be in the entry-level range
How Stockton Financial Advisor Pay Compares
Stockton median: $99,003/year (2026)
| Compared To | Median Salary | Stockton Pays |
|---|---|---|
| California Average | $115,253 | -14.10% less |
| National Average | $108,537 | -8.78% less |
Financial Advisors in Stockton, CA earn a median of $99,003 per year (2026 est.), which is 8.78% lower than the national median of $108,537 and 14.10% below the California state average of $115,253.
Cost-of-Living Adjusted Salary
Stockton has a cost of living 5.09% above the national average.
Adjusted salary = nominal × (100 / CoL index). CoL index: 100 = national average.
Stockton, CA has a cost-of-living index of 105.089 (above the national average of 100). While the nominal salary of $99,003 is competitive, the higher cost of living reduces purchasing power to an effective $94,209 — a 4.84% reduction.
Compare Purchasing Power
Select a city to see how your salary compares after cost of living
Select a city above to compare purchasing power
2019 BLS Actual
$65,600
2025 BLS Actual
$95,840
2026 Current Est.
$99,003
2019–2027 Growth
+55.9%
Salary Trajectory for Financial Advisors in Stockton (2019–2027)
2019–2025: actual BLS OEWS data for this metro area. 2026+: CAGR 3.30% projection.
| Year | Annual Salary | Status |
|---|---|---|
| 2019 | $65,600 | Actual |
| 2020 | $126,220 | Actual |
| 2021 | $75,930 | Actual |
| 2022 | $98,300 | Actual |
| 2023 | $99,590 | Actual |
| 2024 | $105,580 | Actual |
| 2025 | $95,840 | Actual |
| 2026(current) | $99,003 | Estimated |
| 2027 | $102,270 | Projected |
Based on 7 years of BLS OEWS data for the Stockton metropolitan area, the median financial advisor salary grew 46.1% from $65,600 (2019) to $95,840 (2025). At a 3.30% compound annual growth rate, salaries are projected to reach $102,270 by 2027 — a total increase of $36,670 (55.90%) from 2019.
Note: Historical values (2019–2025) are actual BLS OEWS figures for the Stockton metropolitan area, sourced from annual Occupational Employment and Wage Statistics surveys. 2026–2026 figures are current estimates, and 2027 values are projections, calculated using a 3.30% CAGR derived from 7-year BLS historical data. Actual salaries may vary based on employer, experience, certifications, and local market conditions.
Salary by Experience Level
| Experience | Estimated Salary Range |
|---|---|
| 0-2 years (New Graduate) | $62,393 – $71,277 |
| 3-5 years (Mid Career) | $71,277 – $99,003 |
| 5+ years (Experienced) | $99,003 – $133,236 |
| 10+ years (Top Earner) | $133,236 – $233,716 |
CFP, FA salary ranges estimated from BLS percentile data. Individual financial advisor compensation varies by employer, certifications, and specialization.
Financial Advisor Job Market in Stockton
The job market in Stockton is bolstered by approximately 110 financial advisors currently employed in the area, reflecting a solid base for industry professionals. However, the cost-of-living index of 105.089 indicates that while salaries may be lower than the national average, advisors must consider their take-home pay against local expenses. Employers such as Morgan Stanley, Wells Fargo Advisors, and various independent firms can offer higher compensation packages, particularly for advisors with a well-established client base and credentials like the CFP or CFA. Factors such as assets under management and the fee model can create a significant pay gap, with RIAs typically providing a more stable income than commission-based structures found in wirehouses. For those in Stockton aiming to enhance their financial advisor pay, cultivating a niche client base and pursuing fee-based models over commission may prove beneficial.
More salary data for Stockton, CA:
Frequently Asked Questions
How much do financial advisors make in Stockton, CA in 2026?
Is Stockton, CA a good place to work as a financial advisor?
Can financial advisors make $100K in Stockton?
What is the cost-of-living adjusted financial advisor salary in Stockton?
How much does a financial advisor make per hour in Stockton?
Related Pages
Compare Salaries
Career Resources
Nearby Cities in California
Written by Jordan Lee, CFP
Career Analyst
Jordan has over 10 years of experience in financial planning. They specialize in retirement planning for individuals. They work at a financial services firm in New York City.
Methodology & Data Source
Salary figures on this page are 2026 projections based on the Bureau of Labor Statistics Occupational Employment and Wage Statistics (OEWS) survey, May 2026 release. The BLS reported a median annual salary of $95,840 for financial advisorsin the Stockton metropolitan area. A 3.30% compound annual growth rate (CAGR), calculated from 6-year national BLS wage trends, was applied to project current 2026 compensation. Percentile ranges (P10–P90) represent the full salary distribution across experience levels and practice settings in this market.
Data Sources & Methodology
Source: BLS, OEWS, 7-year dataset (–). Per-city data from annual BLS metropolitan area surveys.
2026 figures are projected from 2025 BLS data using a compound annual growth rate (CAGR) of 3.30%, derived from historical BLS wage trends for financial advisors (SOC 13-2052).
Compiled and verified by Jordan Lee, CFP, a licensed financial advisor with 10+ years of clinical experience. · View source data at BLS.gov